Overview
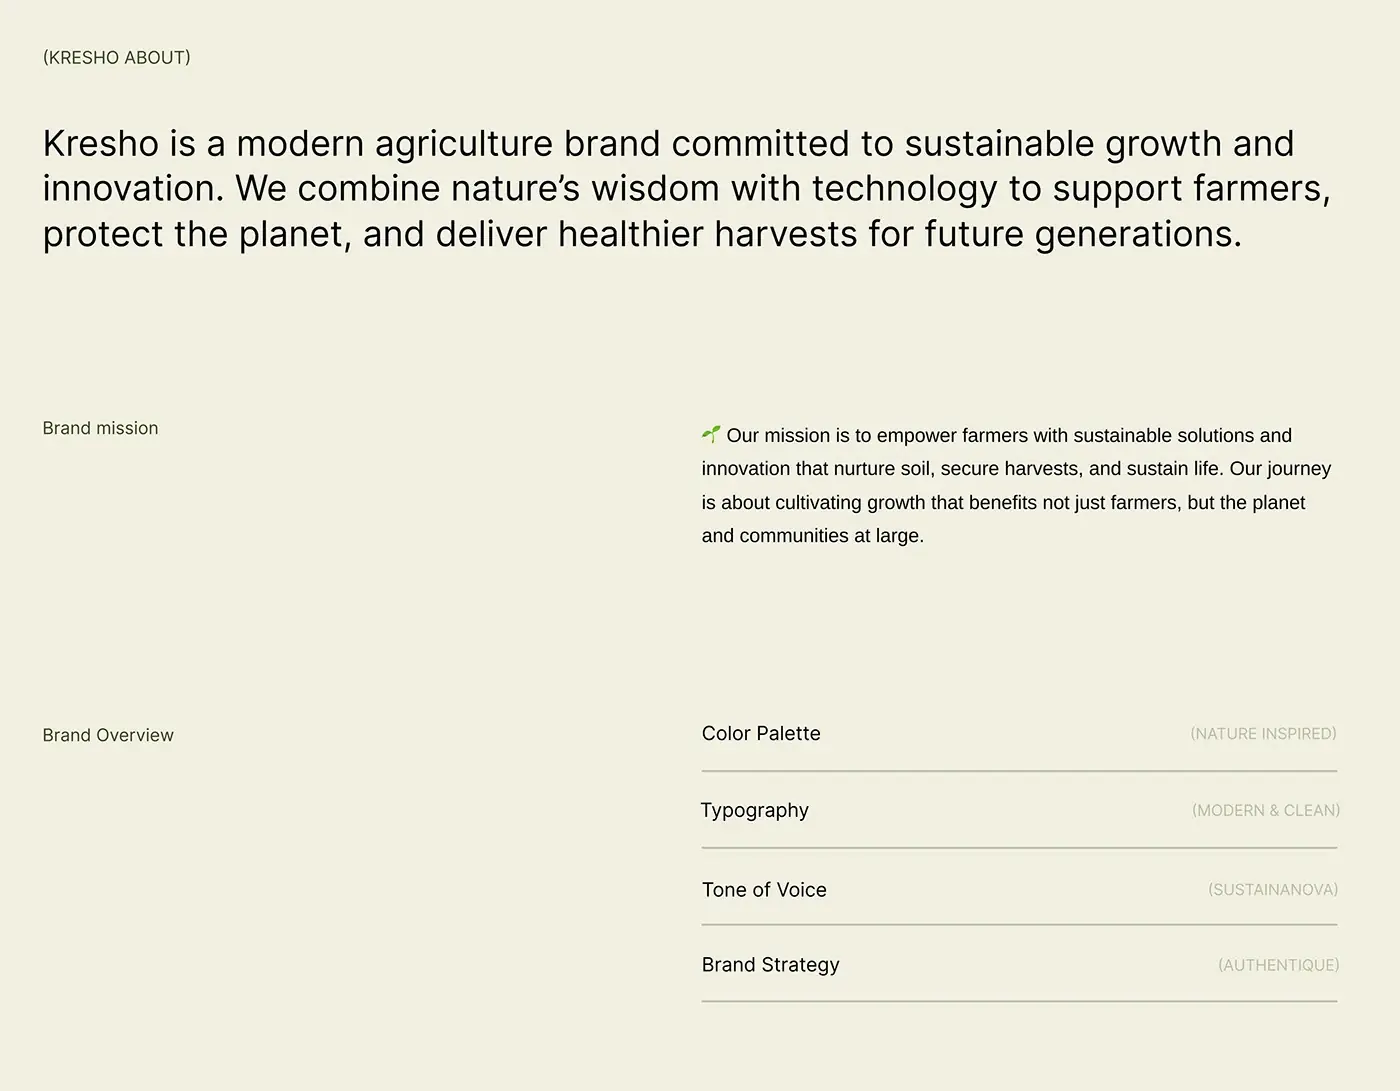
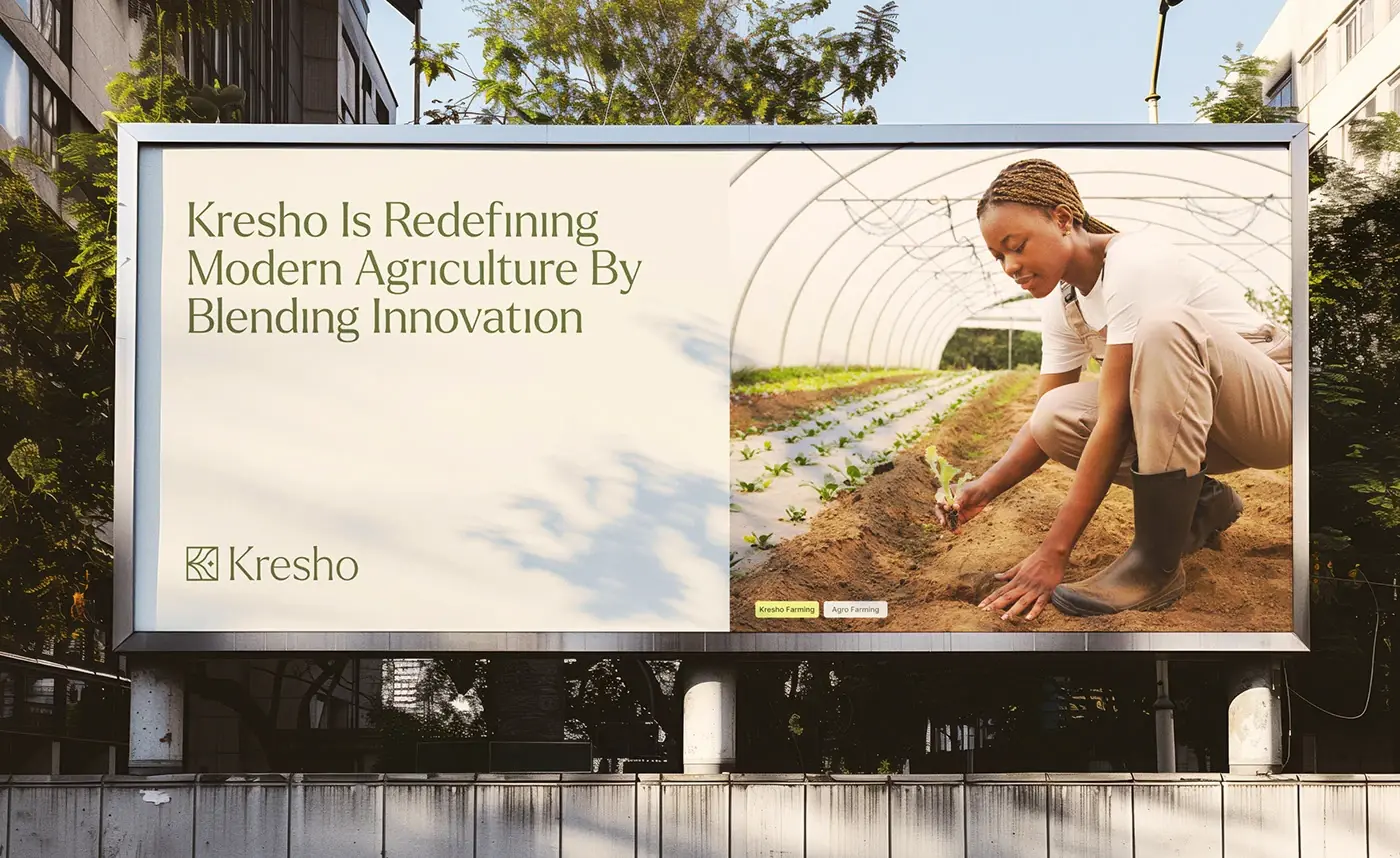
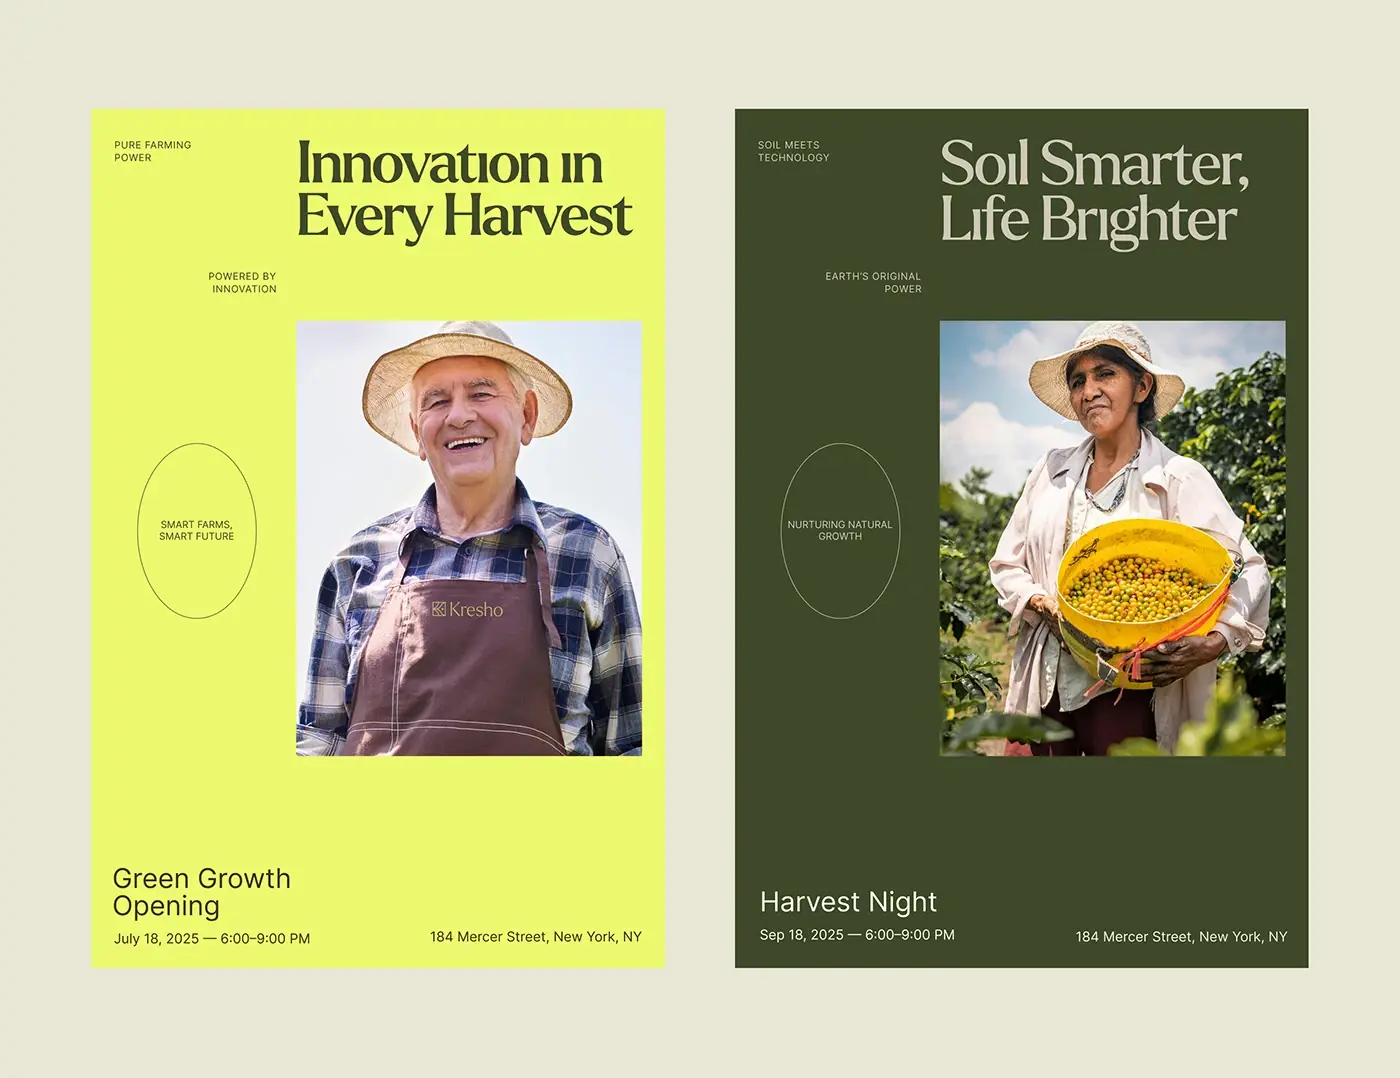
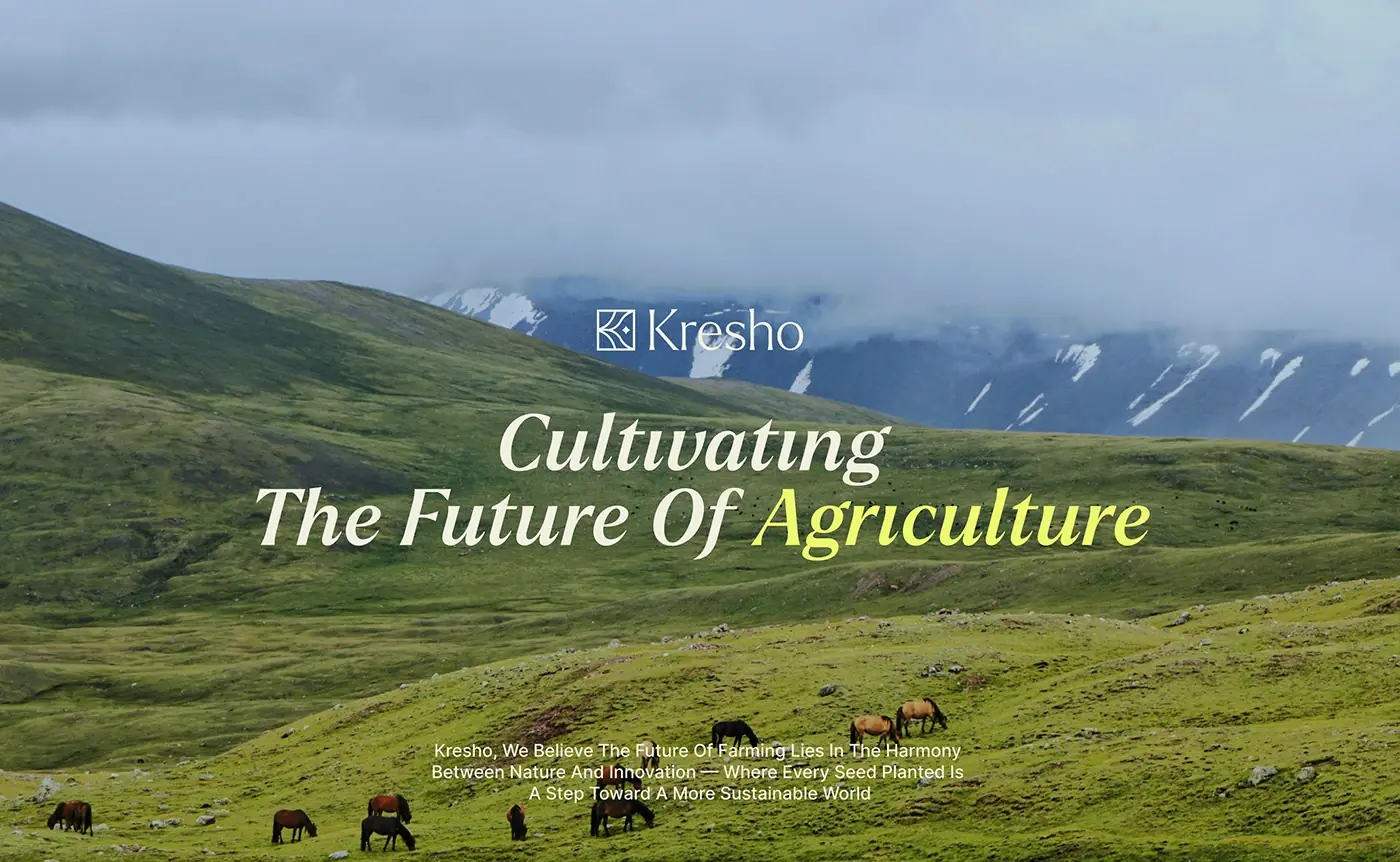
This agriculture app design case study covers Kresho, a modern agriculture company that pairs nature with technology to support farmers. I designed its product screens: a web dashboard, phone screens for tracking farm resources and a website hero, plus the type and colour they share.
The challenge
A farm runs on lots of small numbers, and the screens had to show the right ones without clutter.
- Managers need today's harvest hours, active workers and orders in one view.
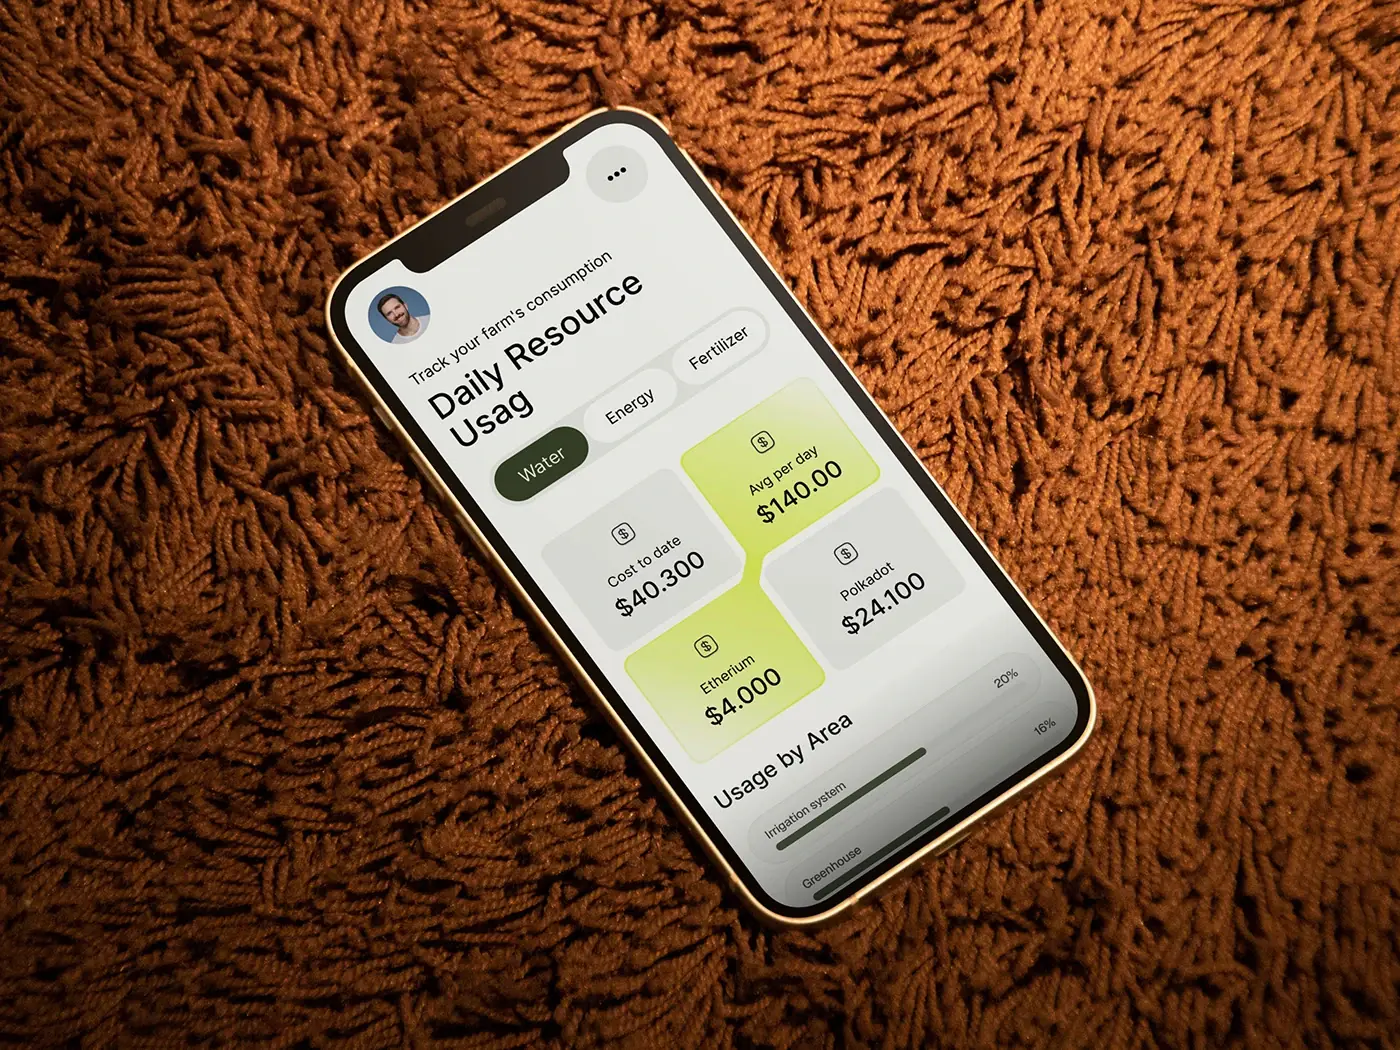
- Water, energy and fertiliser costs have to read clearly on a phone.
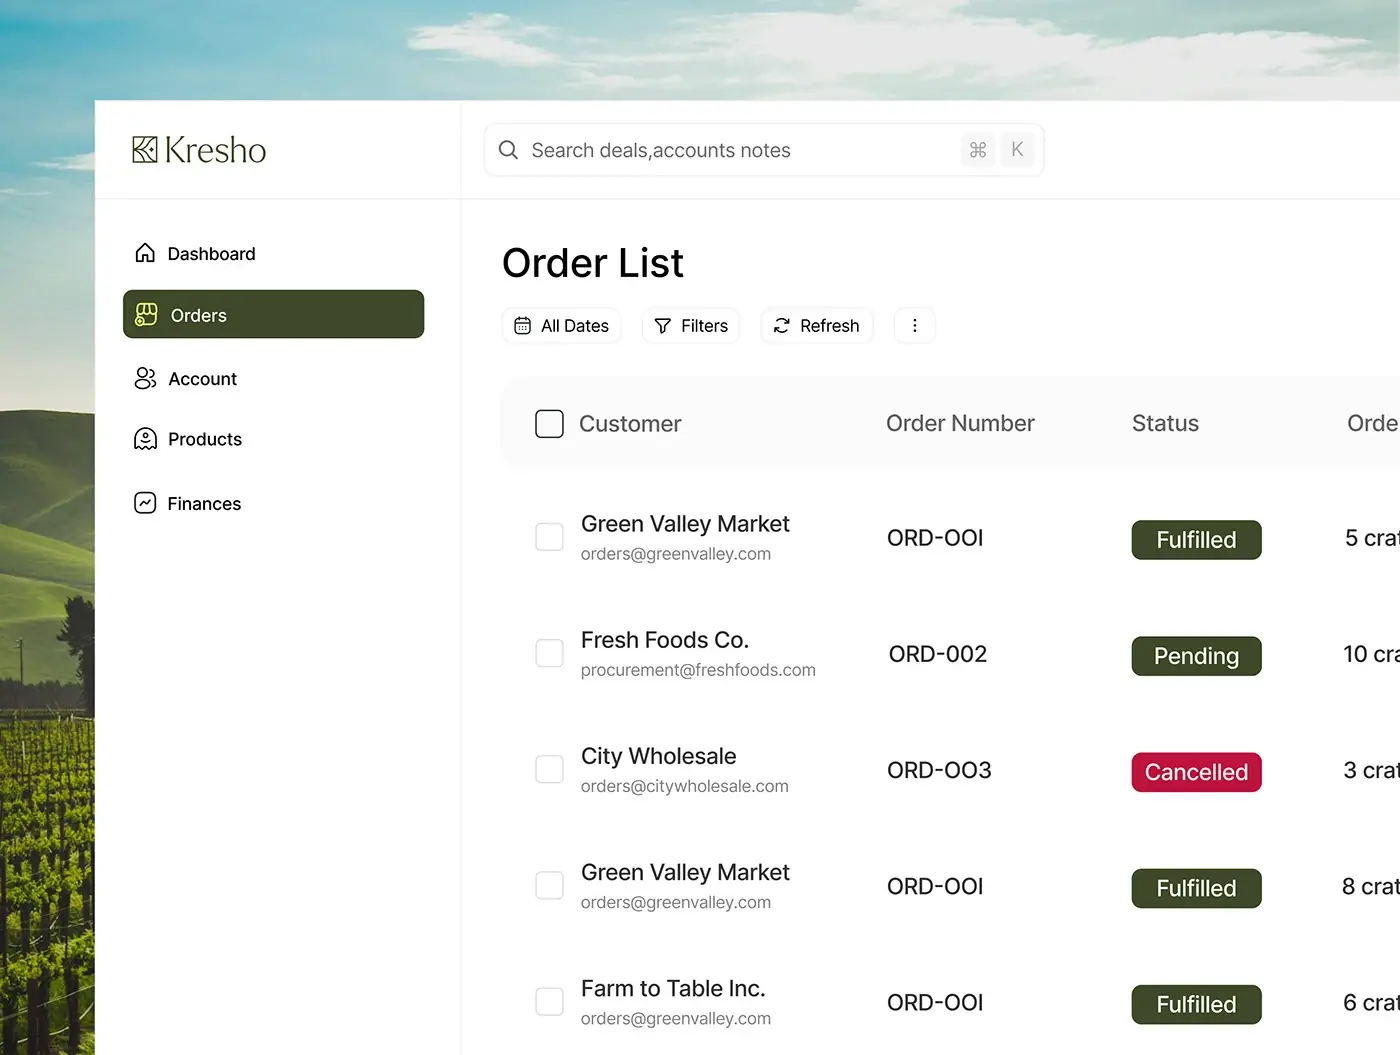
- Orders need a plain status: fulfilled, pending or cancelled.
- Weather, equipment and supply alerts have to show up first.
The process
- Company overview: the mission and the tone of voice.
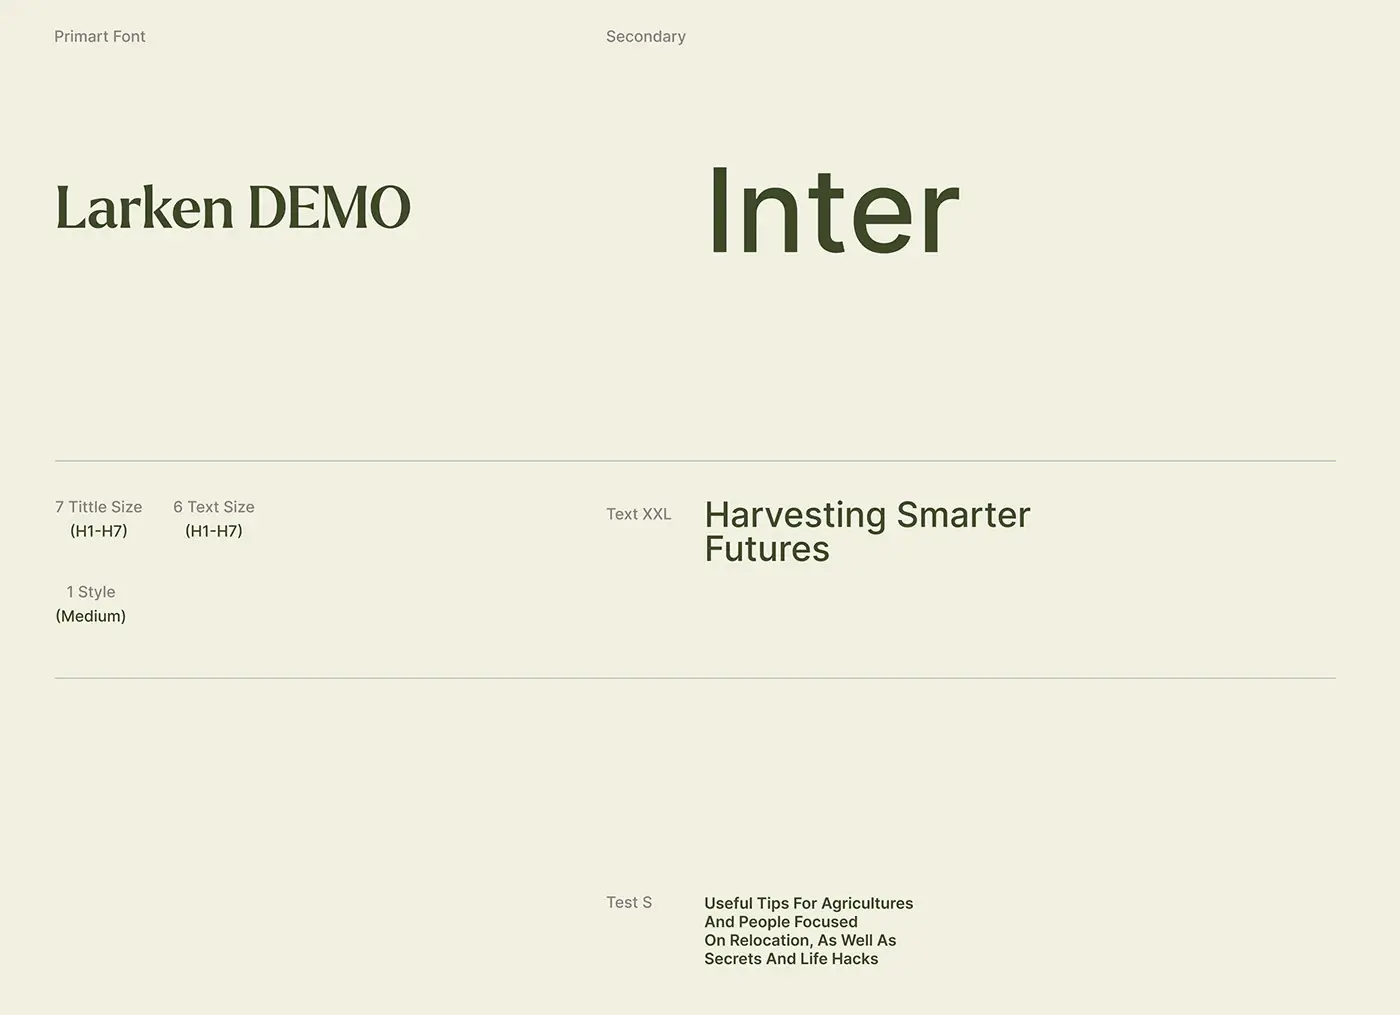
- Type: Larken, a serif in one medium style, for headings and Inter for text.
- Colour: olive green, lime and warm cream.
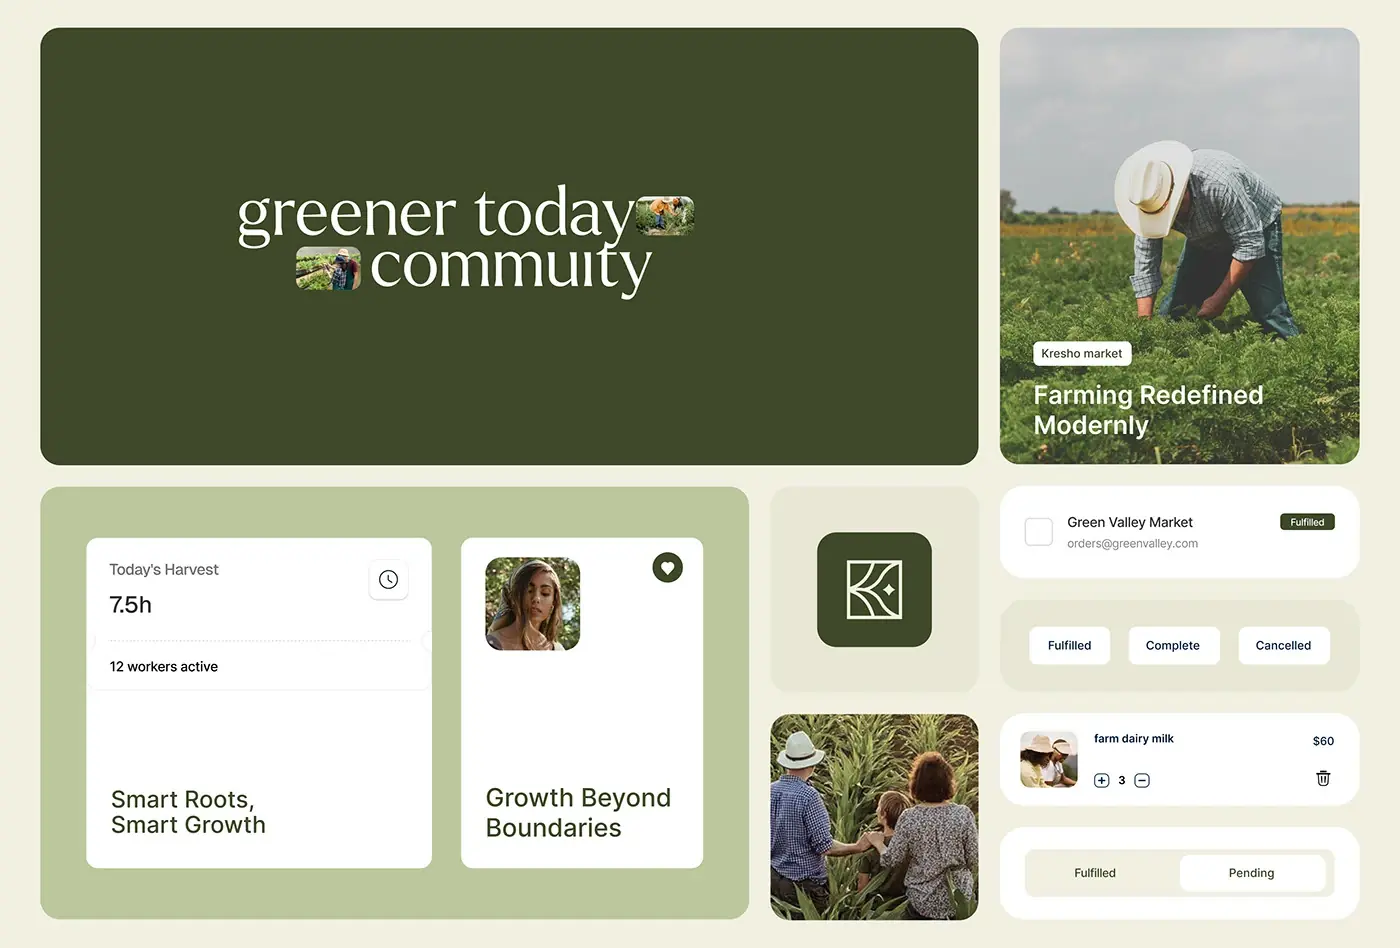
- UI cards for harvest, orders, products and weather.
- Full screens: dashboard, order list, phone tracker and website hero.
The solution
I kept the screens calm and earthy, with big numbers and short labels.
Harvest dashboard
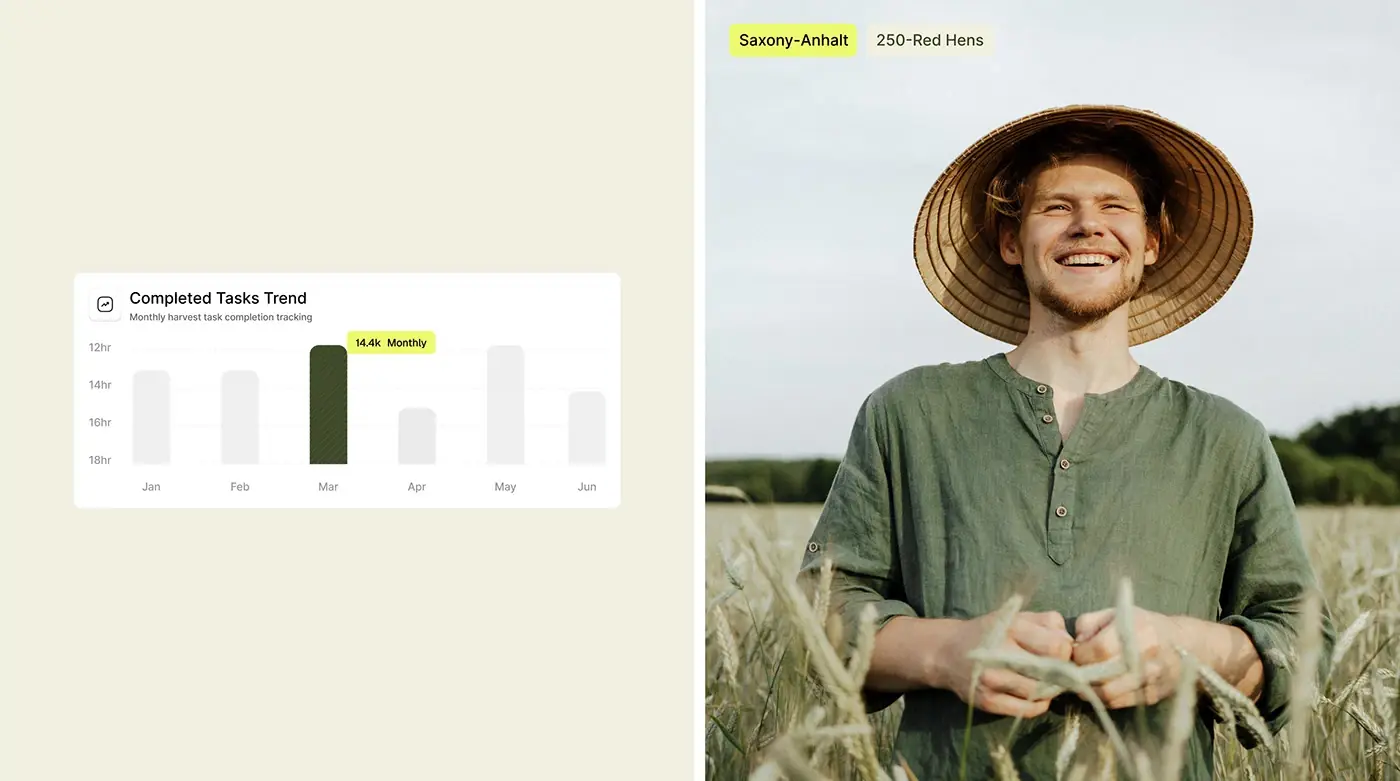
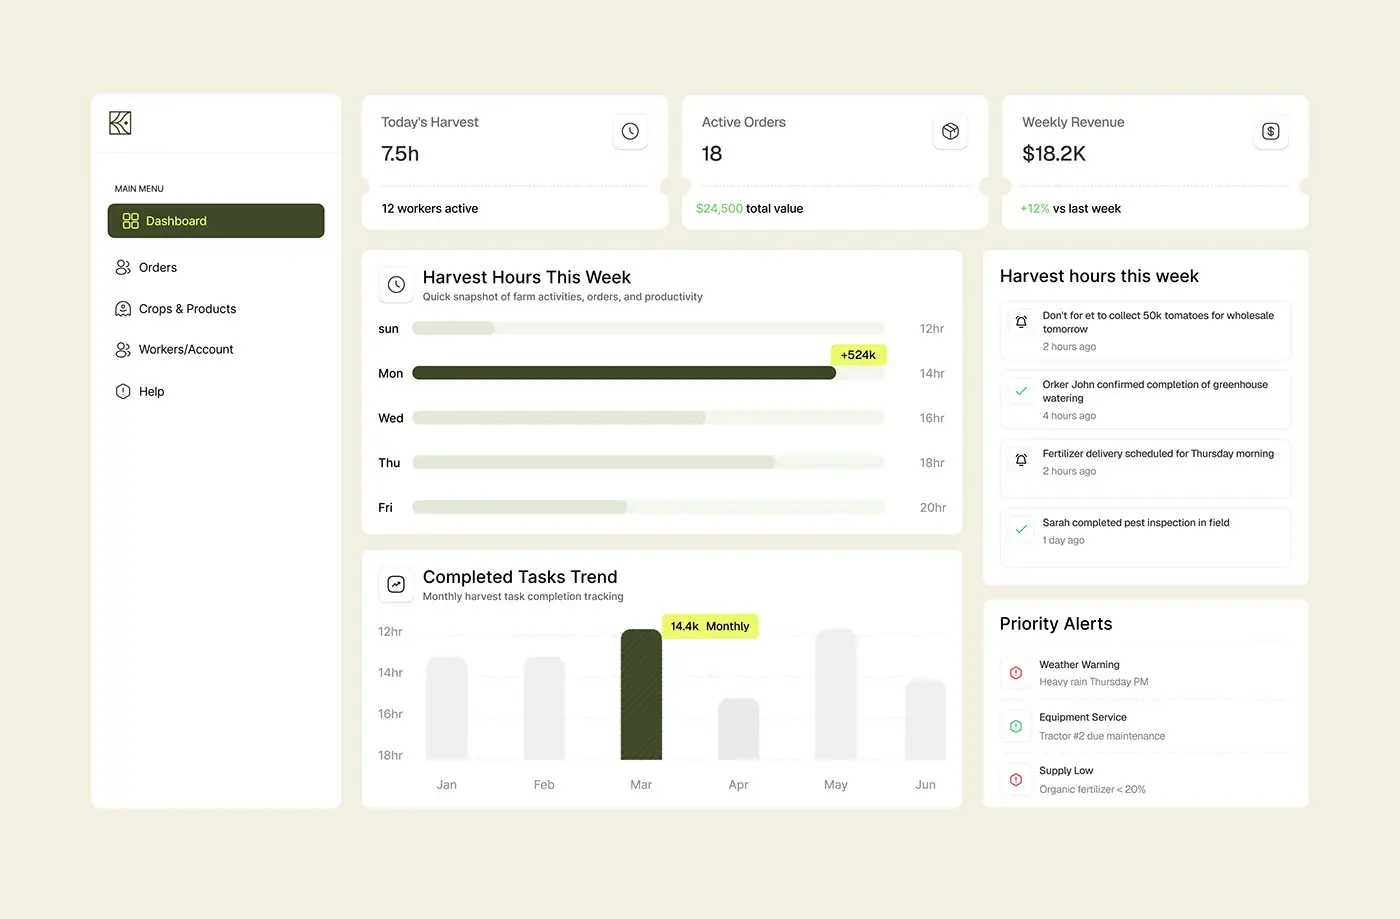
Three cards fill the top row: today's harvest in hours with the number of workers active, active orders with their total value, and weekly revenue with the change against last week. Below them, a bar chart shows harvest hours across the week and a column chart tracks completed tasks by month, with one month picked out in olive green. The sidebar keeps five items: Dashboard, Orders, Crops & Products, Workers/Account and Help. A manager reads the day first and the trend second.
Activity feed and priority alerts
The right column holds a feed of field updates with time stamps: a reminder to collect tomatoes for a wholesale order, greenhouse watering confirmed, a fertiliser delivery booked and a pest inspection done. A clock marks what is pending and a tick marks what is finished. Under it, Priority Alerts lists heavy rain on Thursday, a tractor due for service and organic fertiliser running low, each with a coloured icon. Alerts sit next to the numbers, so they shape the plan for the day.
Order list
The Order List opens with All Dates, Filters and Refresh, under a search bar with a keyboard shortcut. Each row shows a checkbox, the customer's name and email, the order number, a status chip and the number of crates. Fulfilled and pending use olive green, and only cancelled turns red, so a cancelled order stands out in a long list.
Daily resource usage on the phone
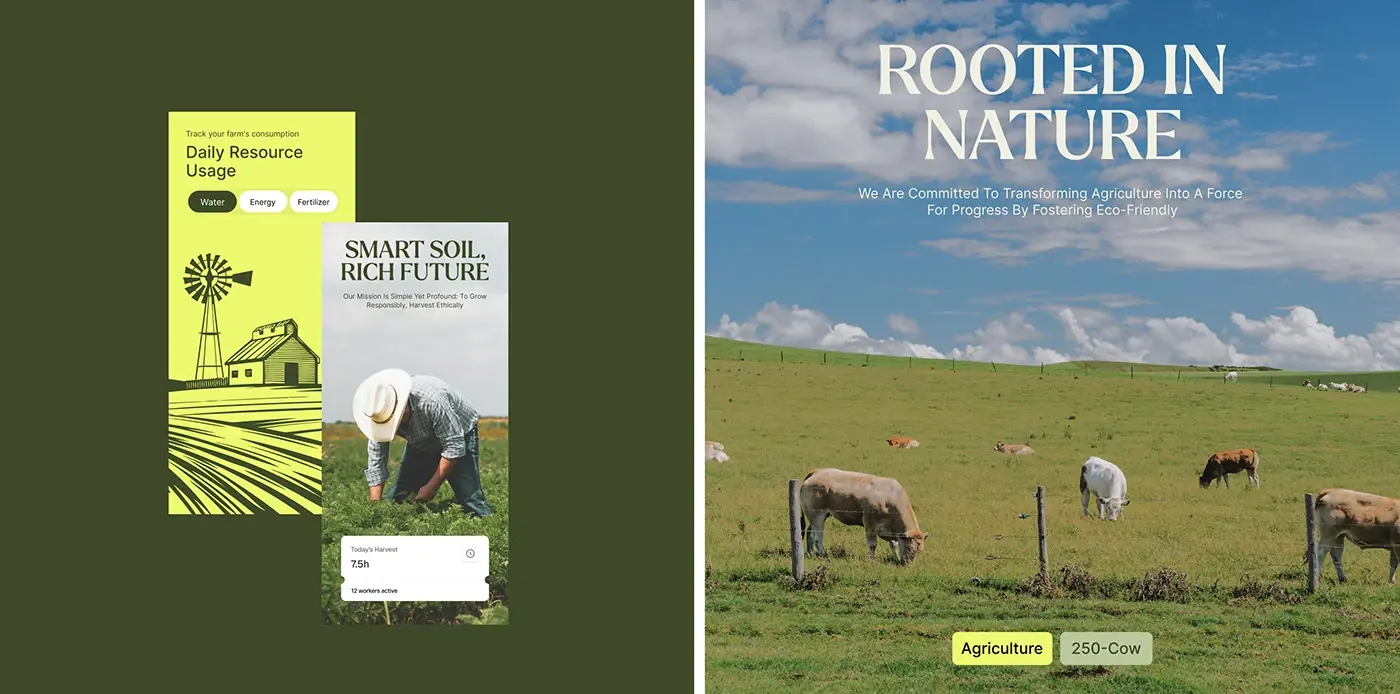
"Track your farm's consumption" heads the phone screen, with tabs for water, energy and fertiliser. Lime and grey cards show cost to date and average per day, and a Usage by Area list puts a bar next to the irrigation system and the greenhouse. One resource at a time, in large figures, keeps the screen readable outdoors. A second version swaps the cards for a line drawing of a windmill and barn on lime.
Market and card library
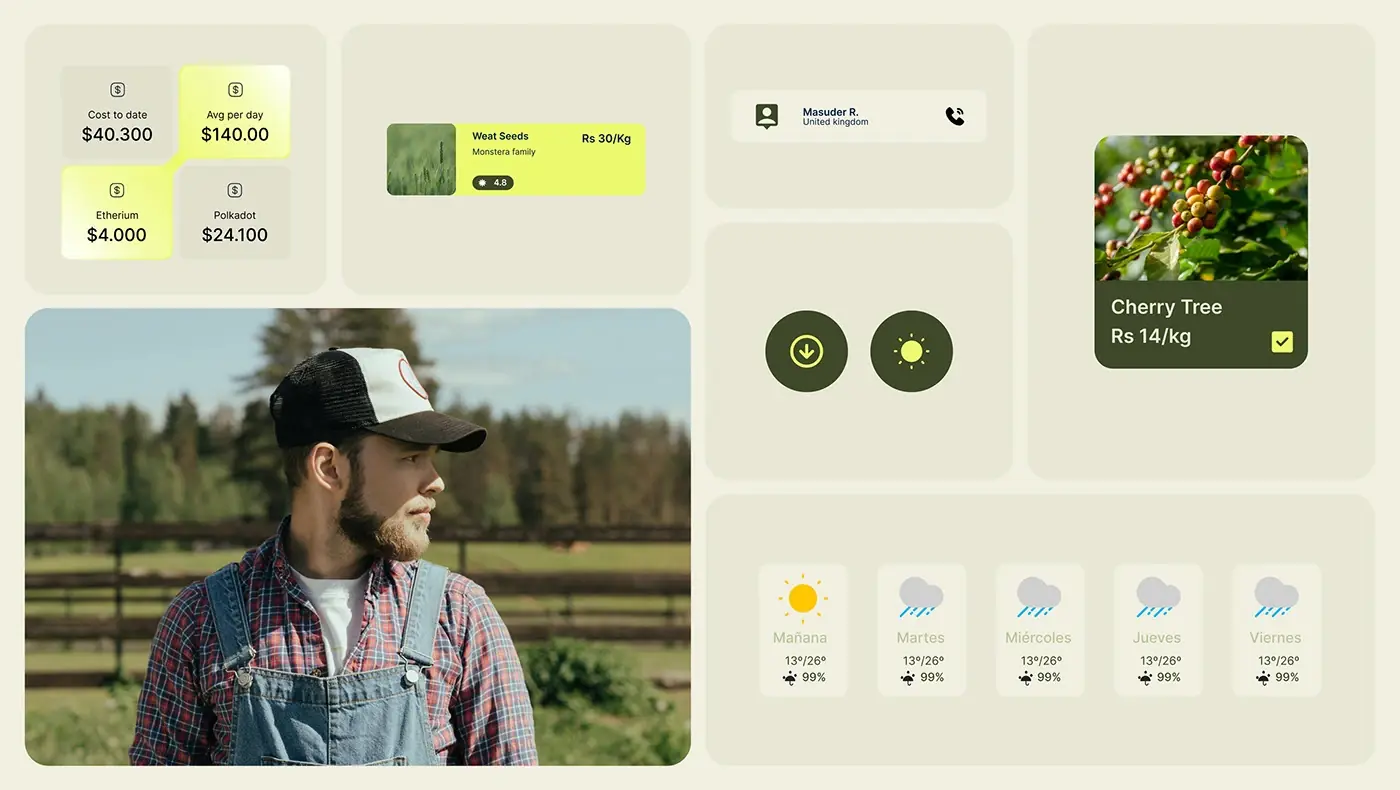
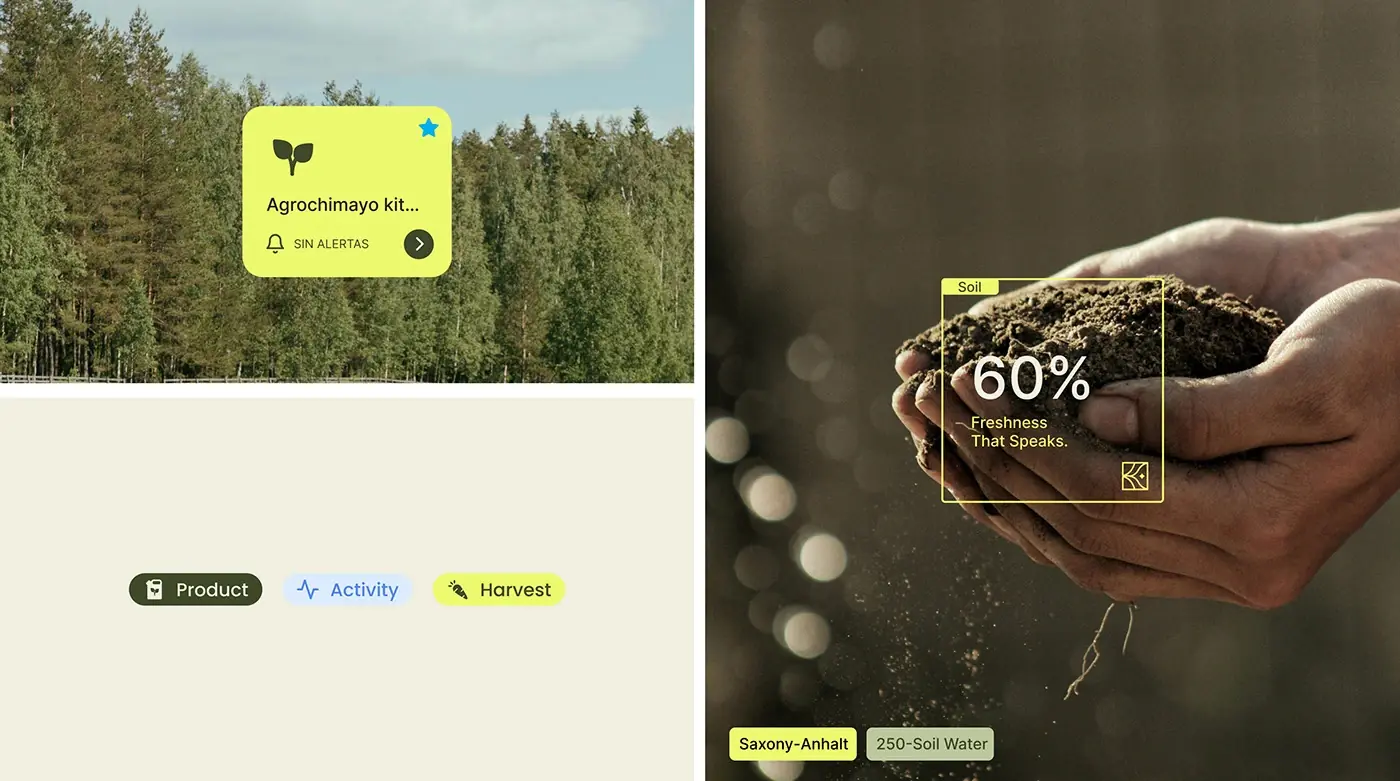
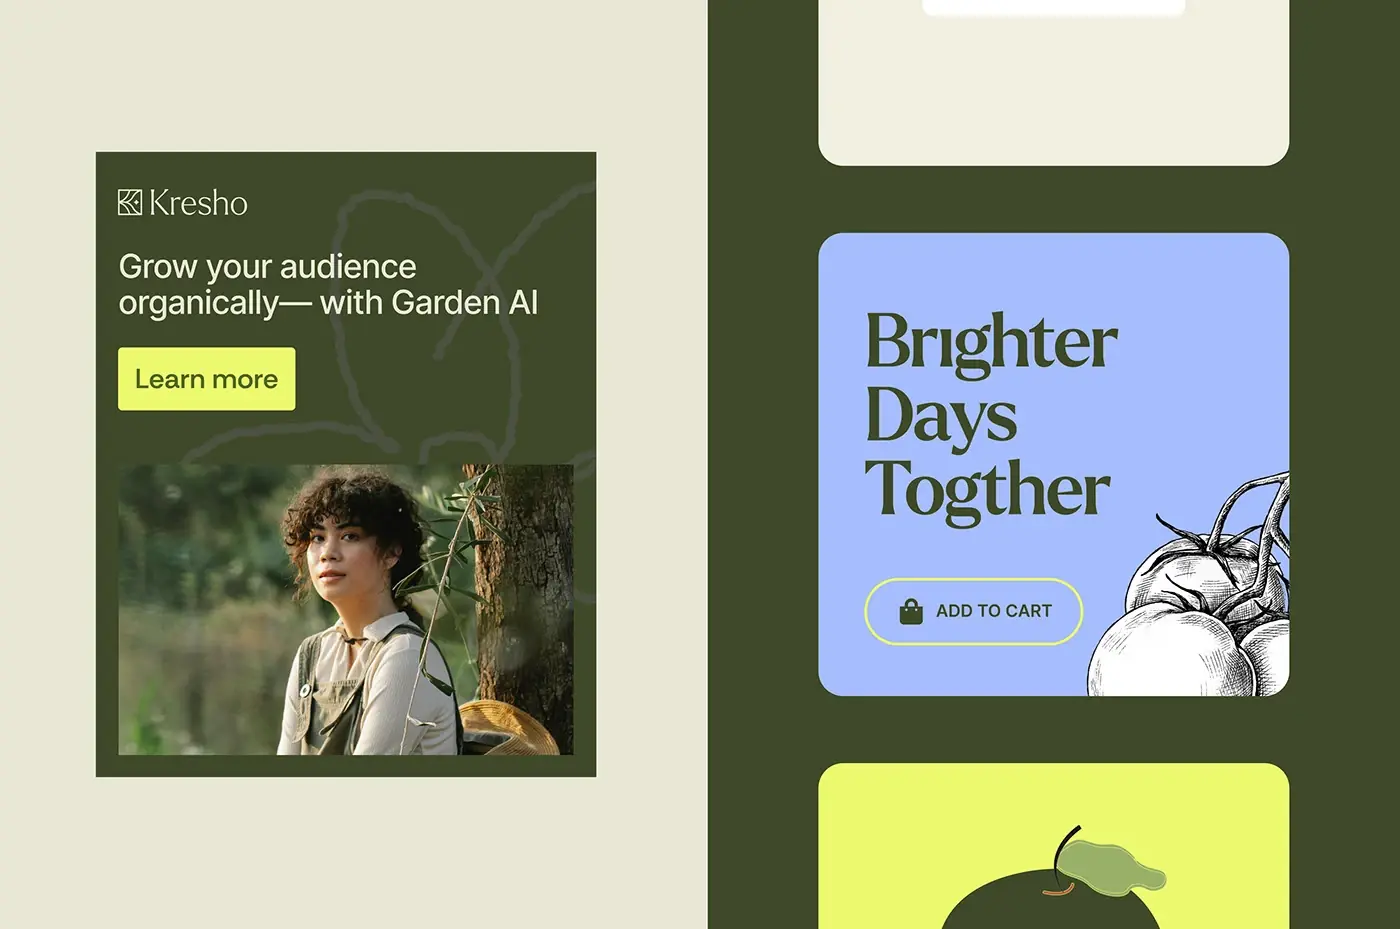
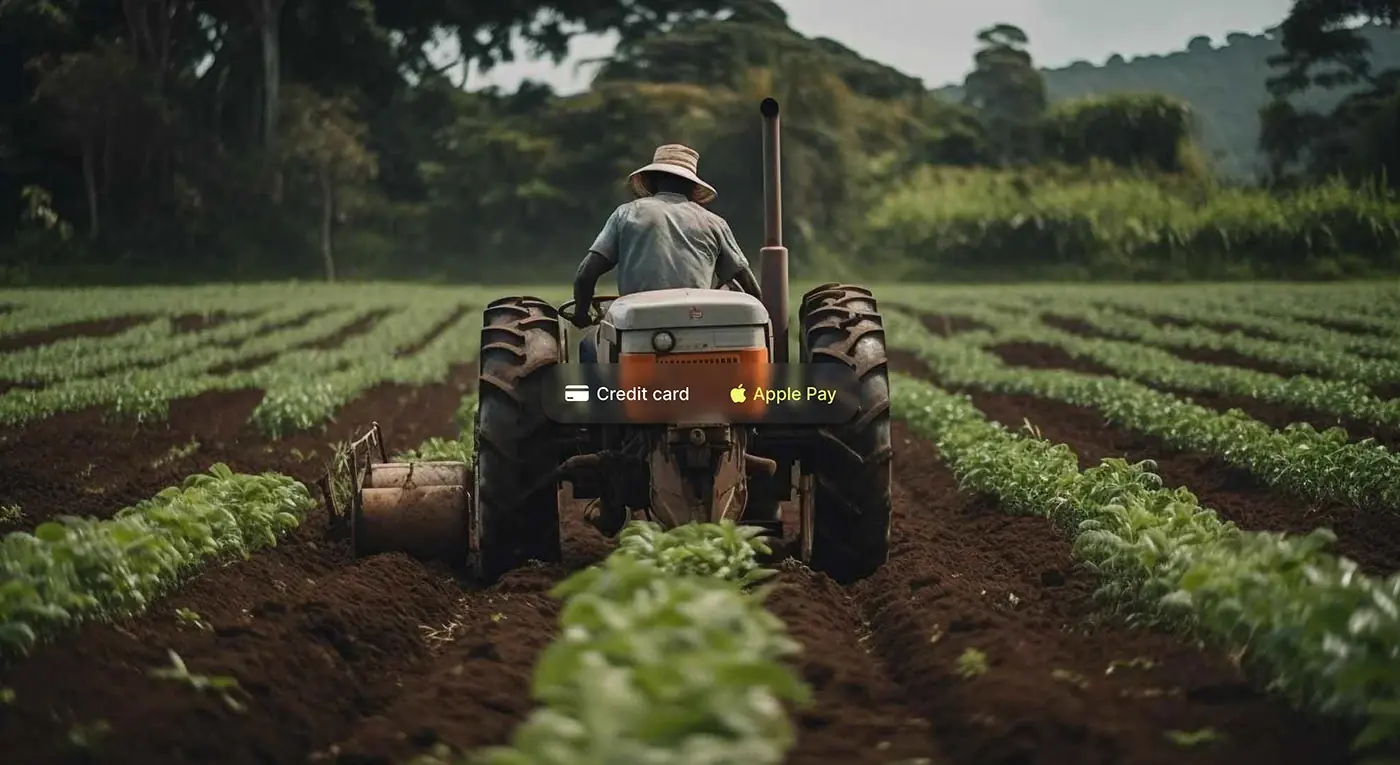
Produce and seed cards show a photo, a price per kilo and a rating, and a cart line adds a quantity stepper and a delete button. A payment switch offers credit card or Apple Pay, a contact card puts a call button beside a person's name, and a five day weather card shows temperatures and the chance of rain. Small chips label product, activity and harvest content. The cards share one corner radius and the same olive, lime and cream, so the set reads as one product.
Website hero
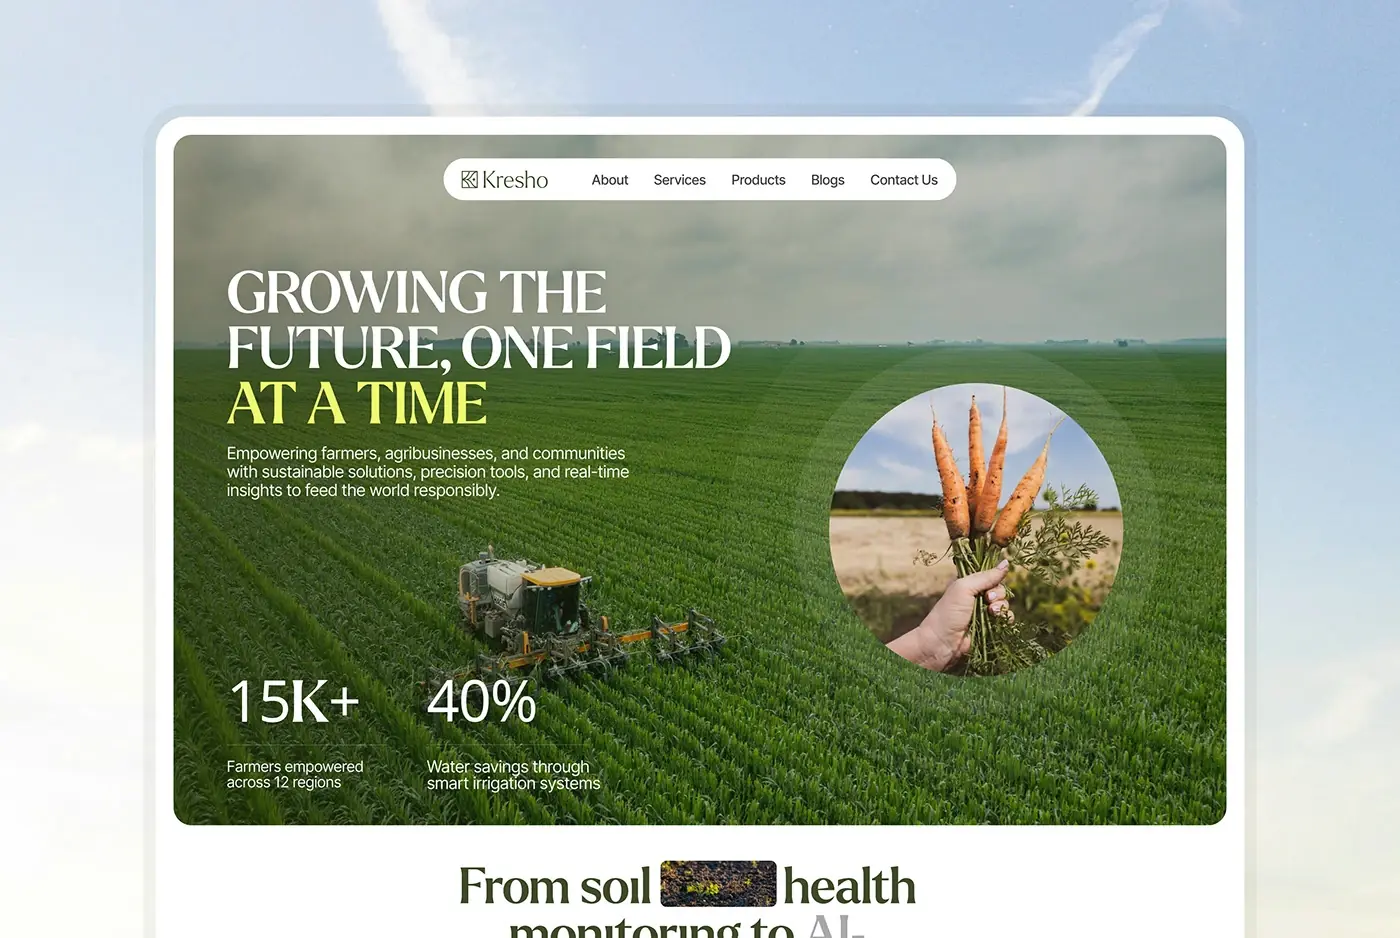
"Growing the future, one field at a time" is set in large capitals over a photo of crop rows, with "at a time" picked out in lime. A white pill menu holds About, Services, Products, Blogs and a contact link. Two headline figures sit at the bottom left and a round photo of fresh carrots sits on the right, a reminder of the produce behind the numbers.
The result
- Web screens: the dashboard and the order list.
- Phone screens for resource usage, and a website hero.
- A card library: harvest, product, cart, payment, contact, order status and weather.
- Type and colour for the product, and the presentation.
How it helps the client
The design gives Kresho one place where farm managers see harvest, orders, workers and resource costs, at a desk or in the field. Alerts sit next to the numbers, so a rain warning is seen before the day is planned. That's how I approach product design for agriculture platforms, and there is more of this kind of work in my dashboard case studies.