
Overview
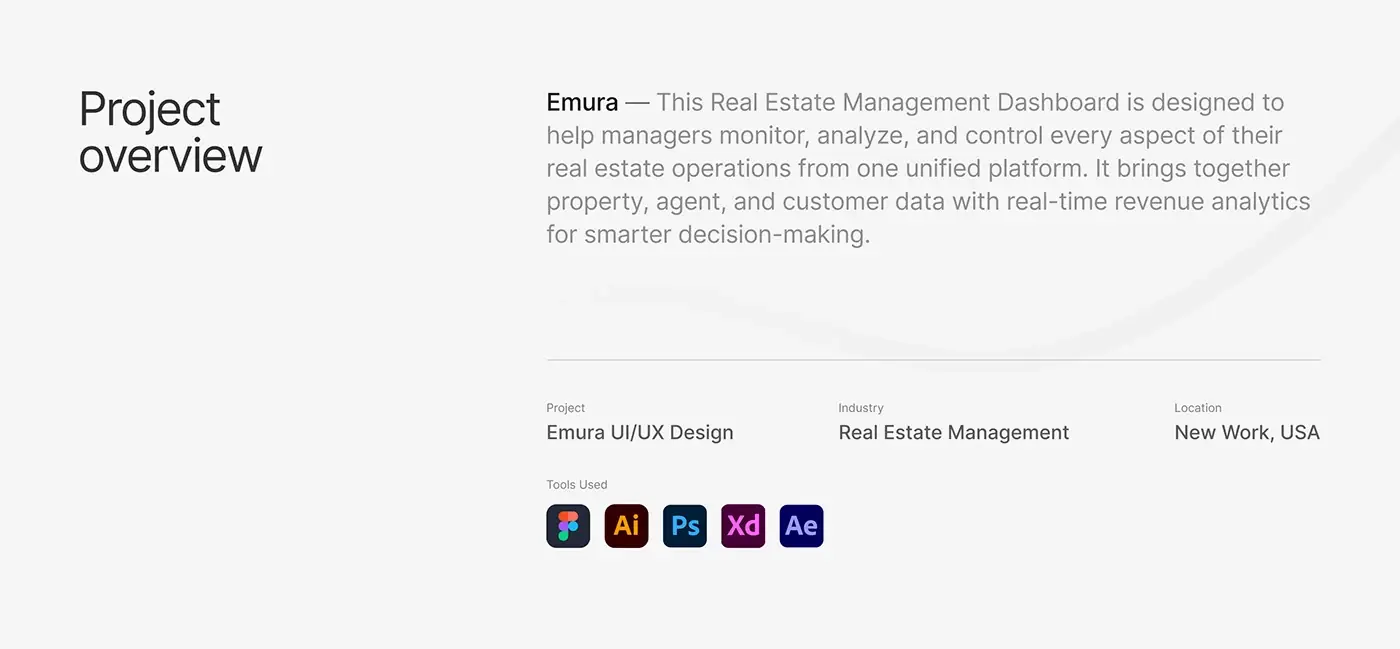
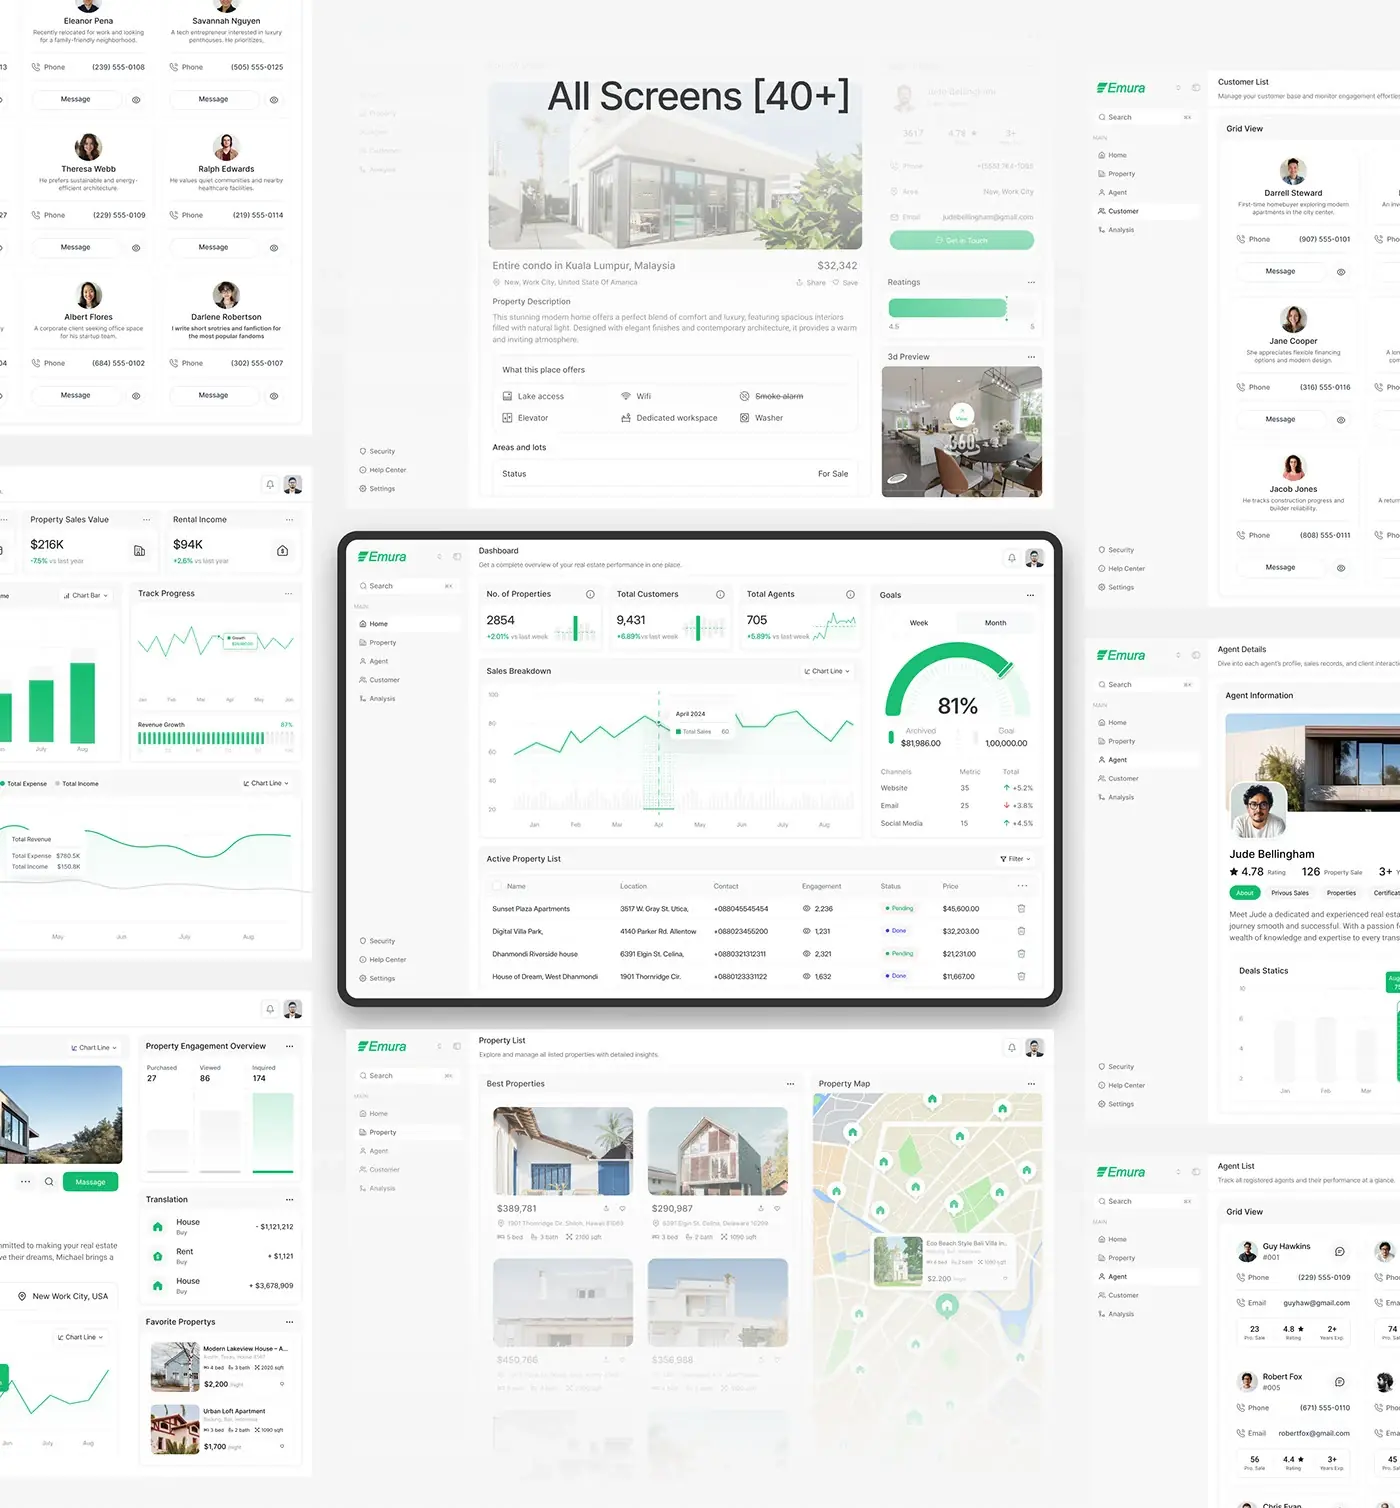
This case study walks through a real estate dashboard design for Emura, a management platform where managers run the whole operation from one place: properties, agents, customers and revenue. I designed the web app, a mobile layout of its dashboard and the design system behind both.
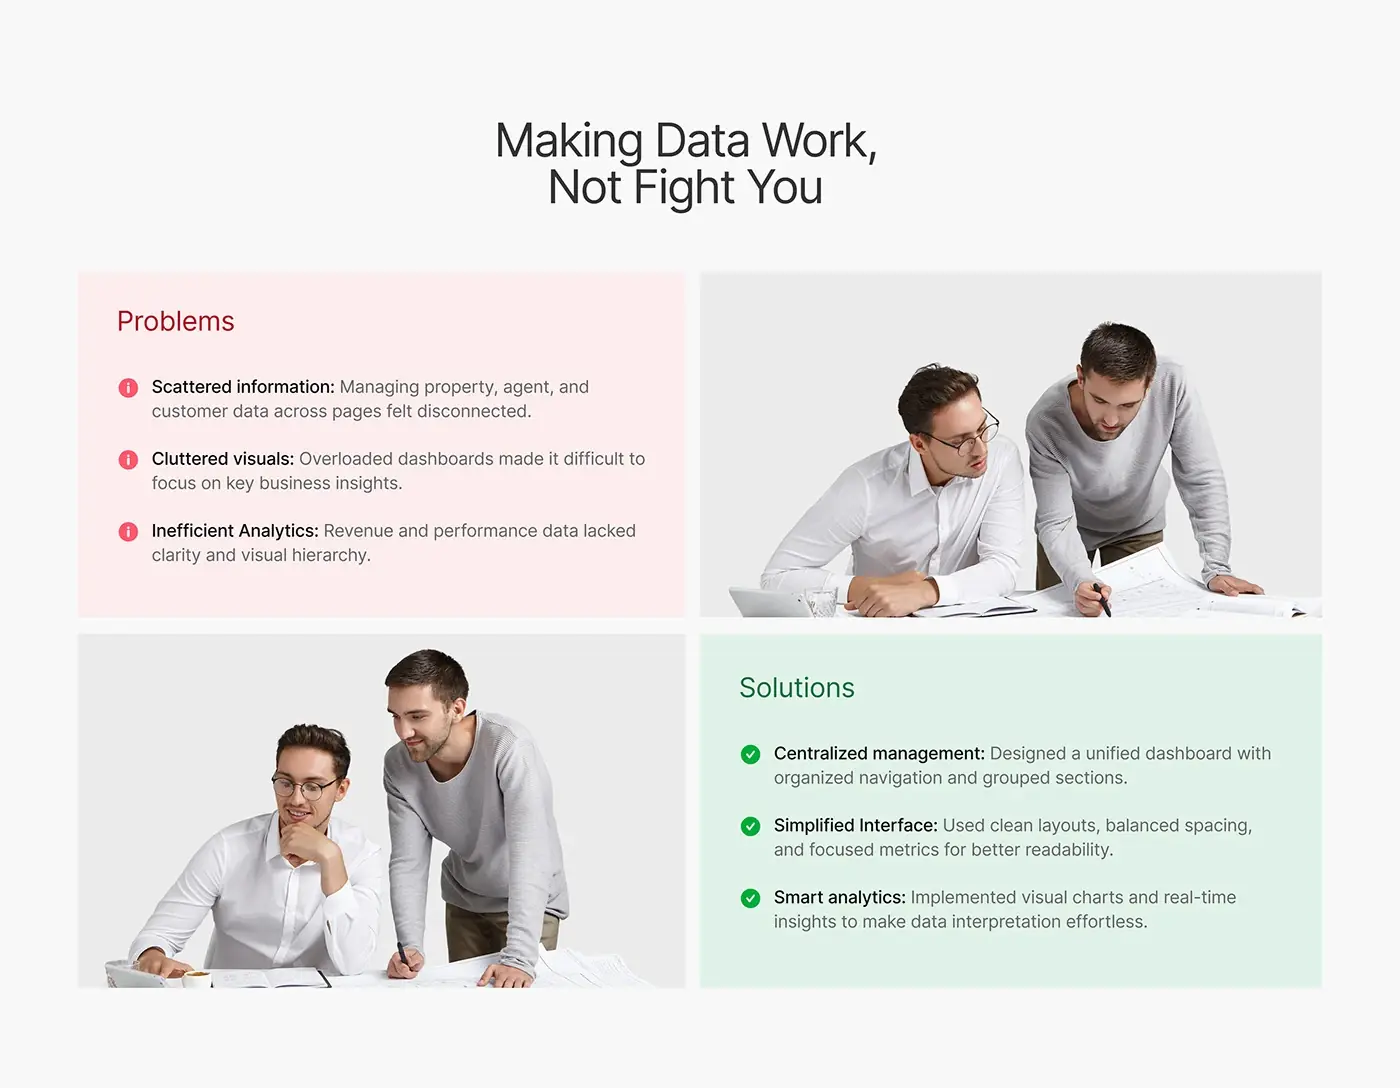
The deck sums up the brief as making data work for managers instead of fighting them.
The challenge
The deck names three problems the design had to fix.
- Property, agent and customer data sat on separate pages and felt disconnected.
- Overloaded dashboards buried the numbers that matter.
- Revenue and performance data had no clear hierarchy.
Each problem got a matching answer: one dashboard with organised navigation and grouped sections, clean layouts with focused metrics, and charts that make revenue easy to read.
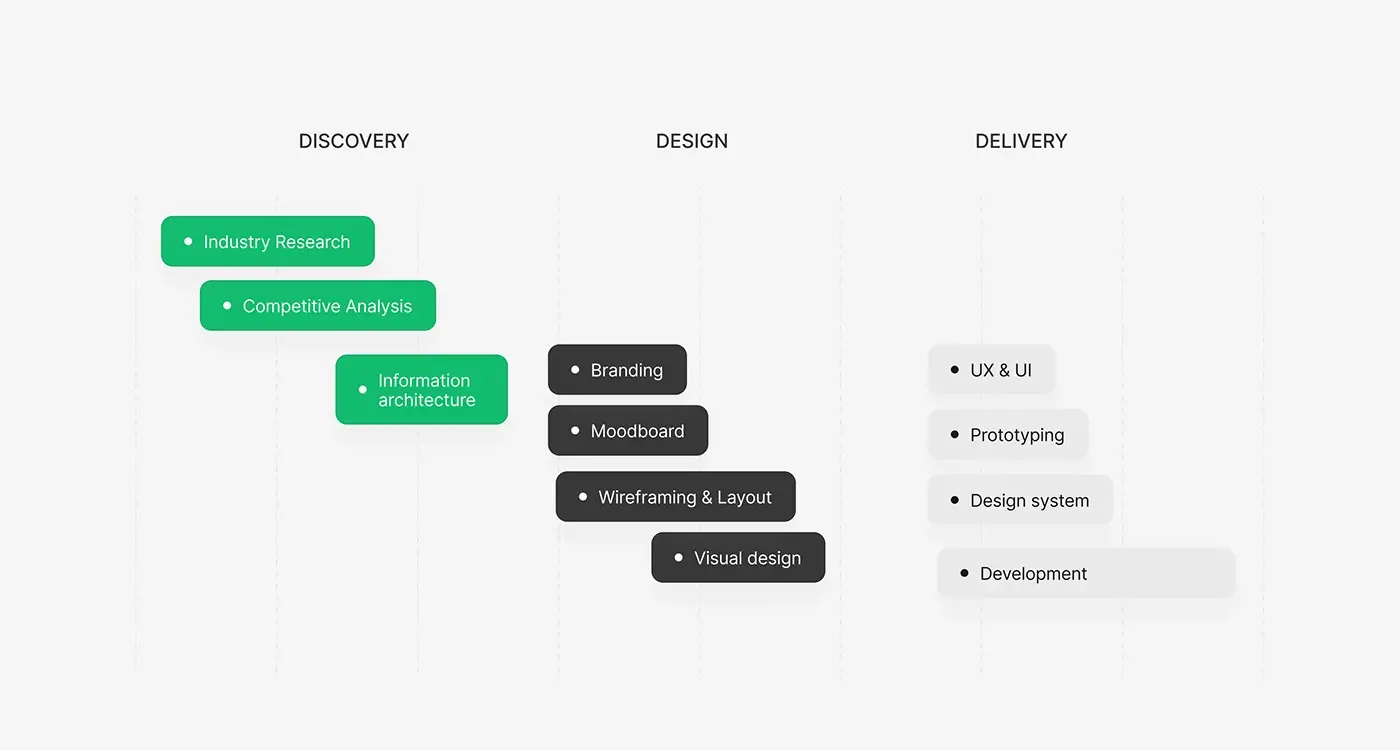
The process
- Discovery: industry research and a competitive analysis.
- Information architecture: Home, Property, Agent, Customer and Analysis.
- A moodboard, then wireframes and layouts.
- High fidelity visual design.
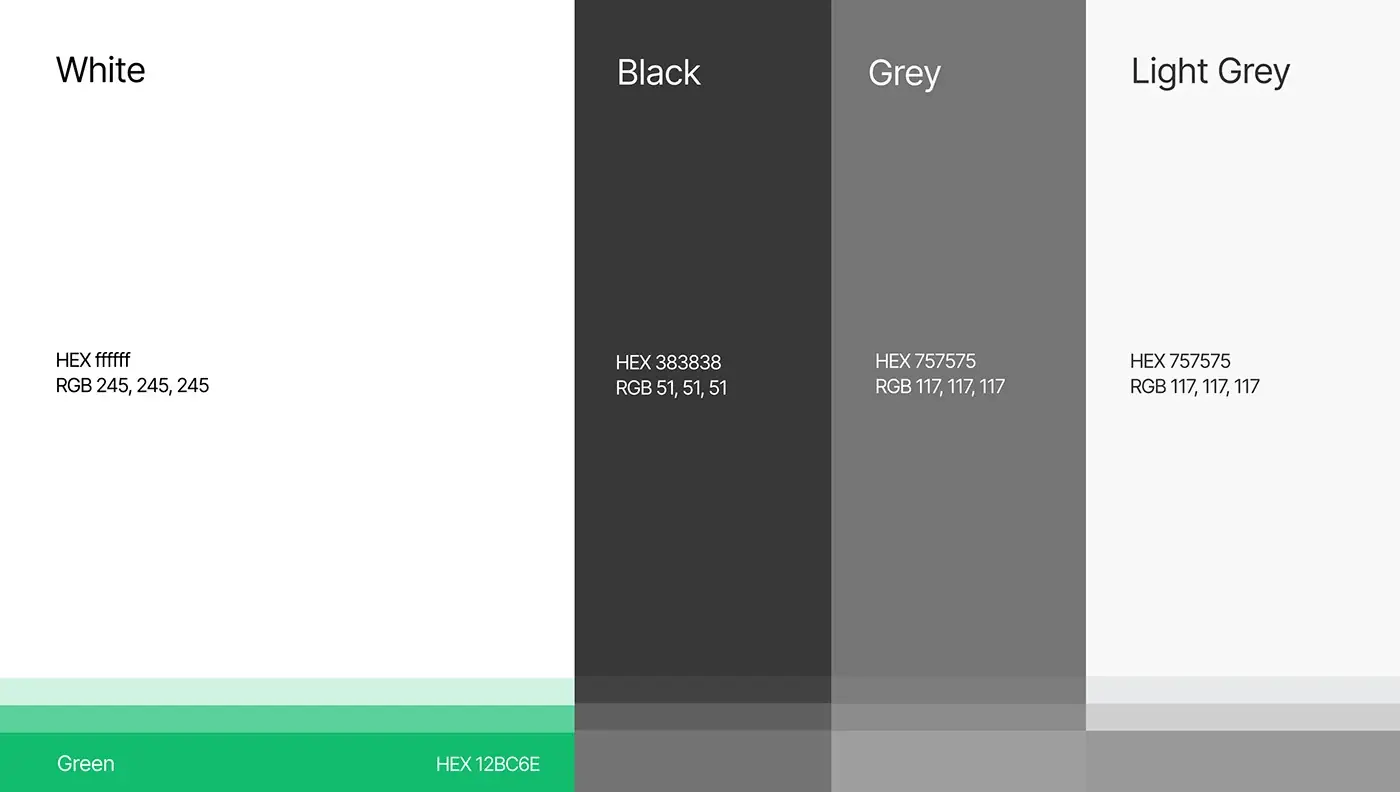
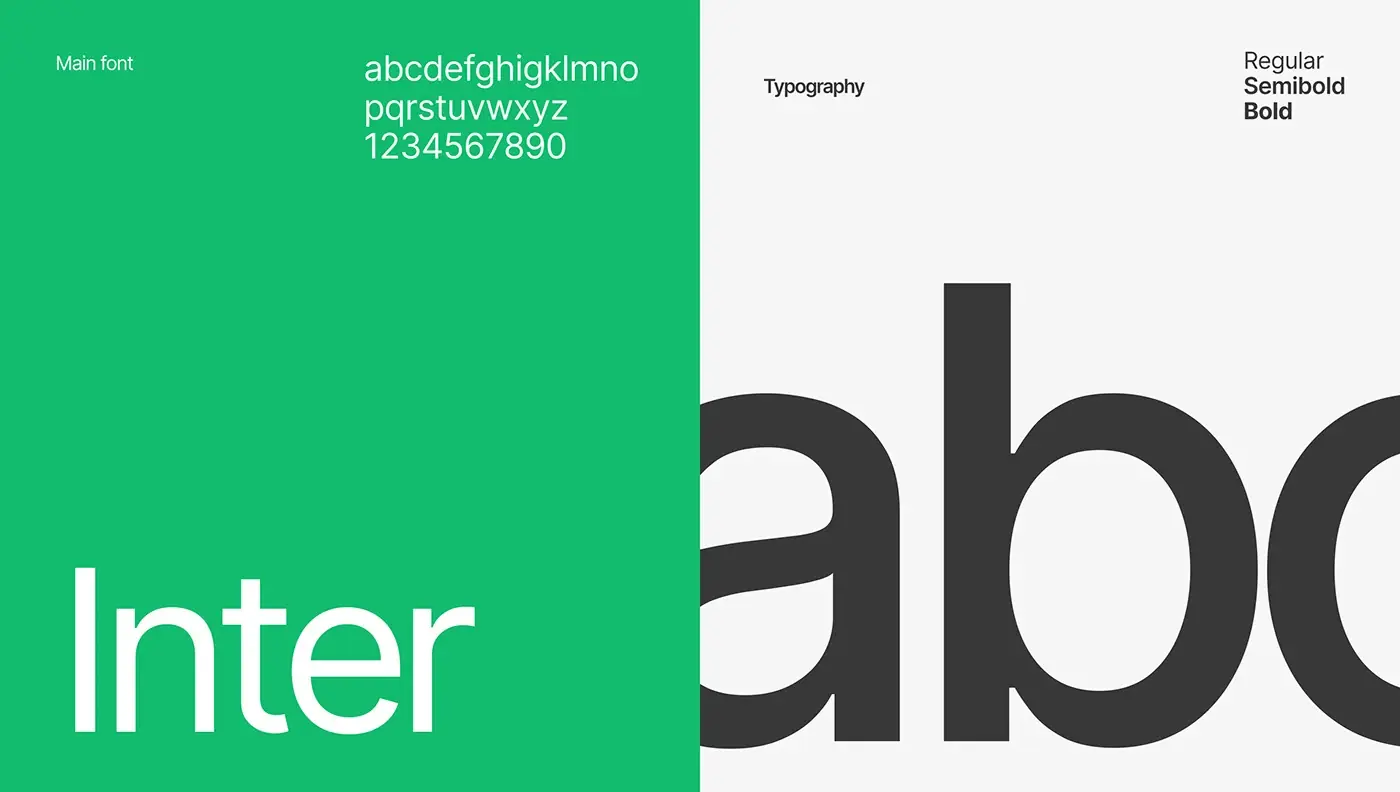
- A prototype and a design system: Inter, one green accent and a grey scale.
The solution
Every record lives in one web app, with the same sidebar on every screen: Home, Property, Agent, Customer and Analysis, with security, help and settings below.
Main dashboard
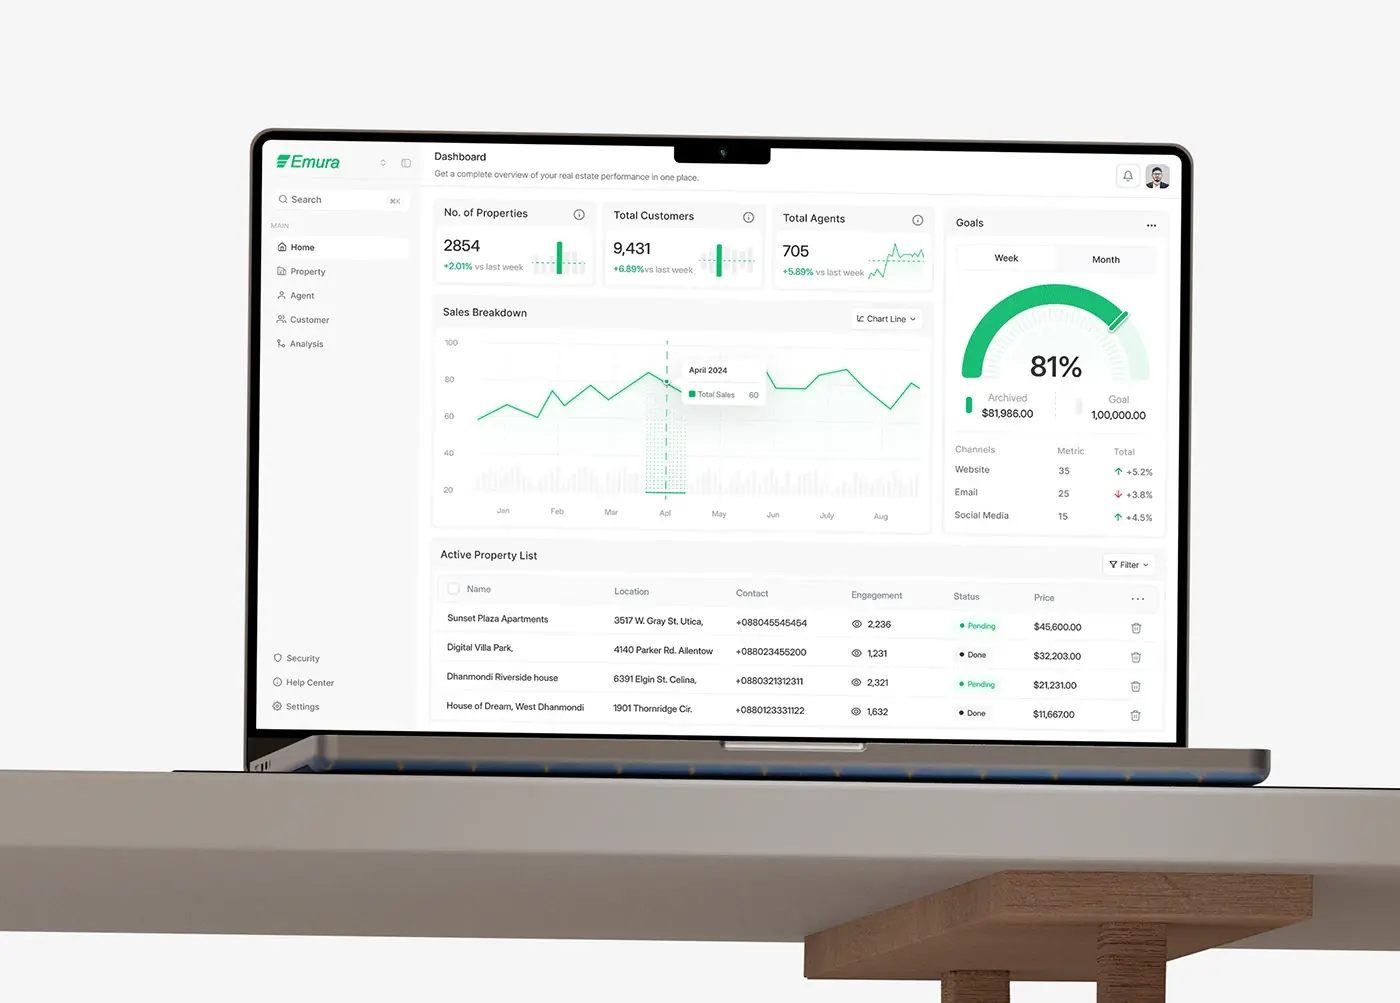
Three count cards (properties, customers and agents) each carry a change against last week and a small trend chart. A sales breakdown chart with a chart type switch sits below, beside a goals gauge with week and month tabs, achieved against target and results by channel: website, email and social media. An active property list closes the screen with location, contact, views, status and price, so the day starts with the whole operation in view.
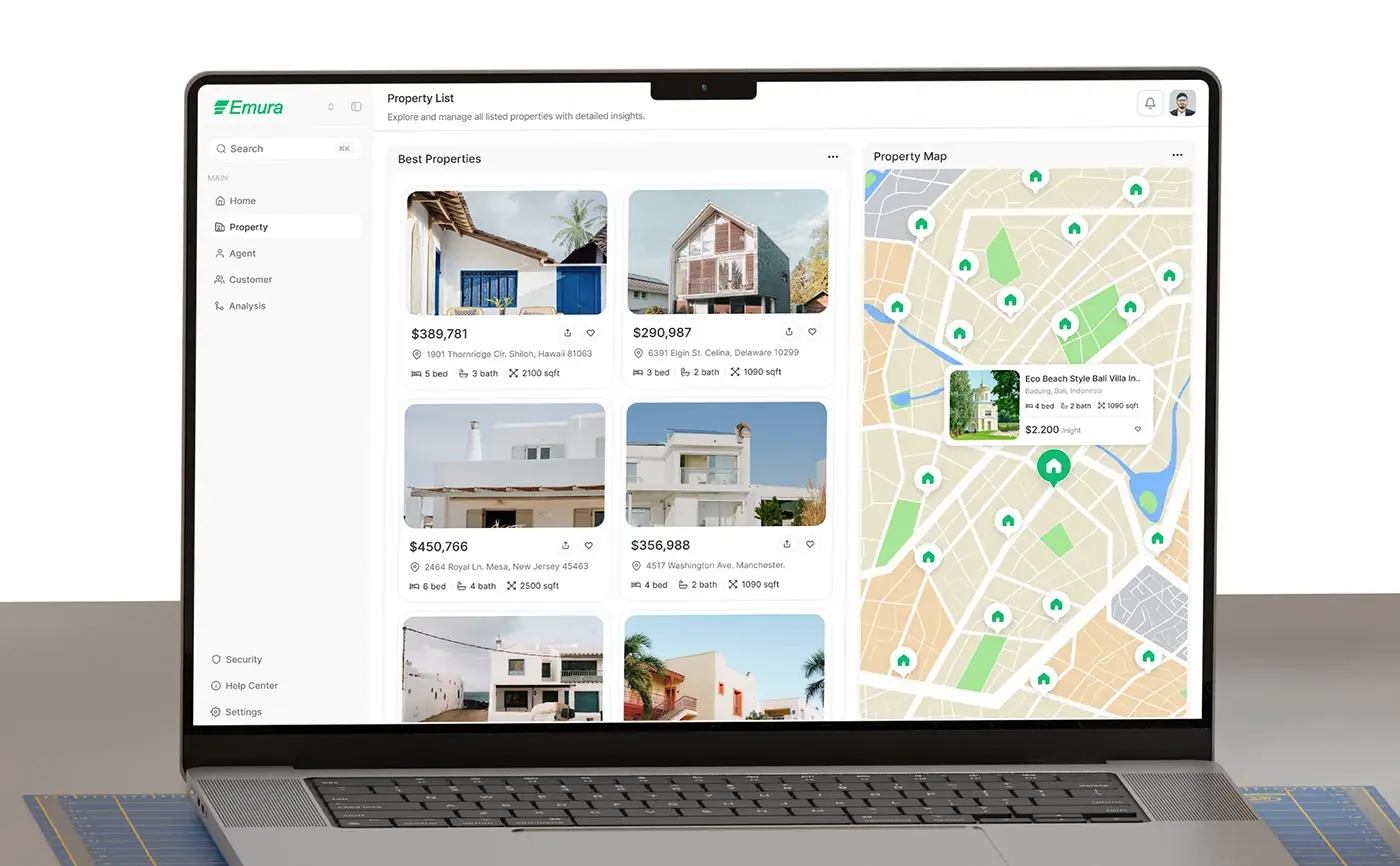
Property list and map
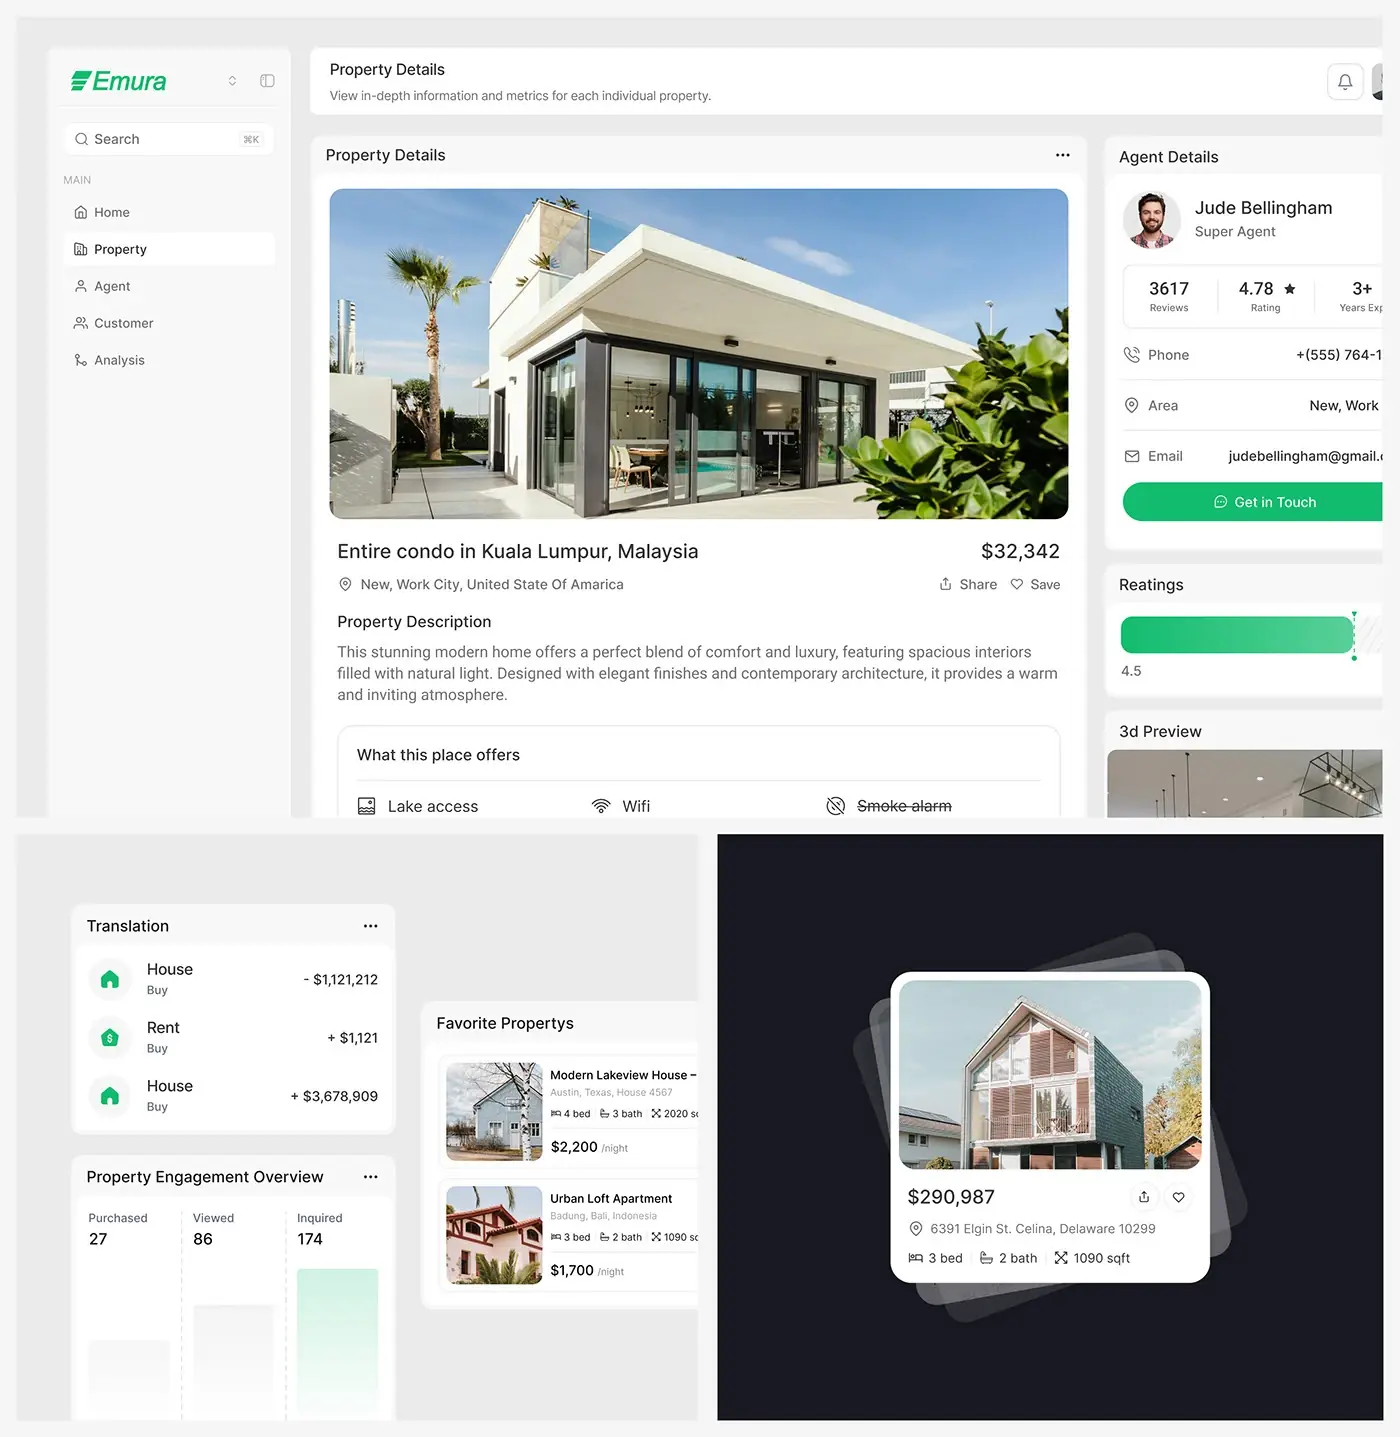
Listing cards show the photo, price, address, beds, baths and floor area, with share and save buttons. A map fills the right half with house pins, and selecting one opens a small card with the photo and price. Location is the first question about any property, so the map gets as much room as the list.
Property details
One page holds the listing and its seller. Photos, title, price and address lead, then the description, a "What this place offers" amenity grid and lot details with the sale status. The right column shows the assigned agent with reviews, rating, years of experience, phone, area, email and a Get in Touch button, then ratings and a 3D preview.
Agents
The agent list is a grid of cards with an ID, phone, email, properties sold, rating and years of experience, so a manager can compare people at a glance. An agent's page adds a profile, tabs for previous sales, properties and certificates, and a deals chart.
Customers
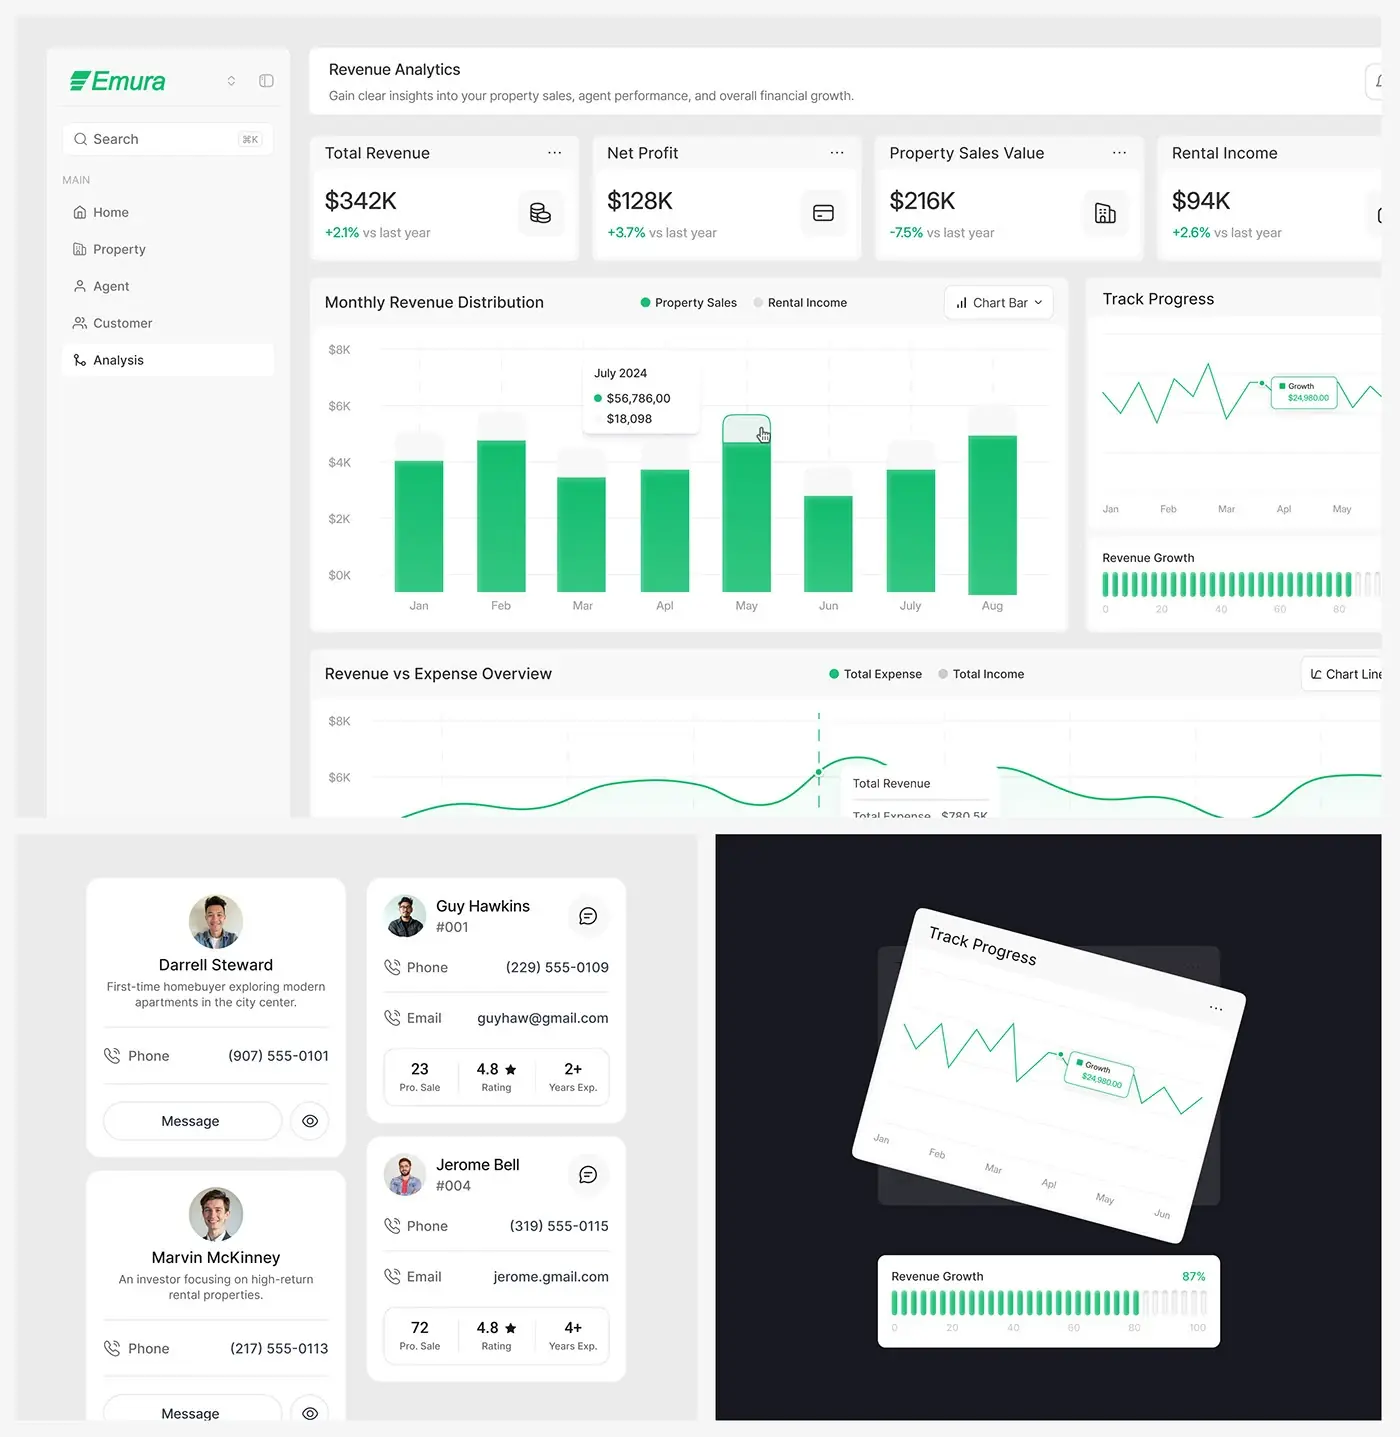
Customer cards lead with what each person wants, for example a first-time homebuyer exploring city centre apartments or an investor after high-return rentals, then a phone number, a Message button and a view link. Whoever picks up the card reads the need before making the call.
Revenue analytics
Four cards sit at the top: total revenue, net profit, property sales value and rental income, each against last year. Below, a monthly bar chart splits property sales from rental income, beside track progress and a revenue growth meter, then a revenue against expense chart. The money reads top to bottom, from totals to the months behind them.
Mobile dashboard
The mobile layout stacks the same count cards for properties, customers and agents in one column, each with its weekly change and mini chart, above the sales breakdown. A manager away from a desk sees the same numbers first, in the same order.
The result
- The web app, which the deck lists as 40+ screens: dashboard, properties, agents, customers and analytics.
- A mobile layout of the dashboard cards.
- A design system foundation and a prototype.
How it helps the client
Emura can give managers one place to check stock, people and money, instead of three tools that don't talk to each other. Pending listings, sales and progress against the goal share one screen, and every listing shows the agent behind it. Planning something similar? See how I approach product design for real estate platforms, or browse more real estate case studies.