
Overview
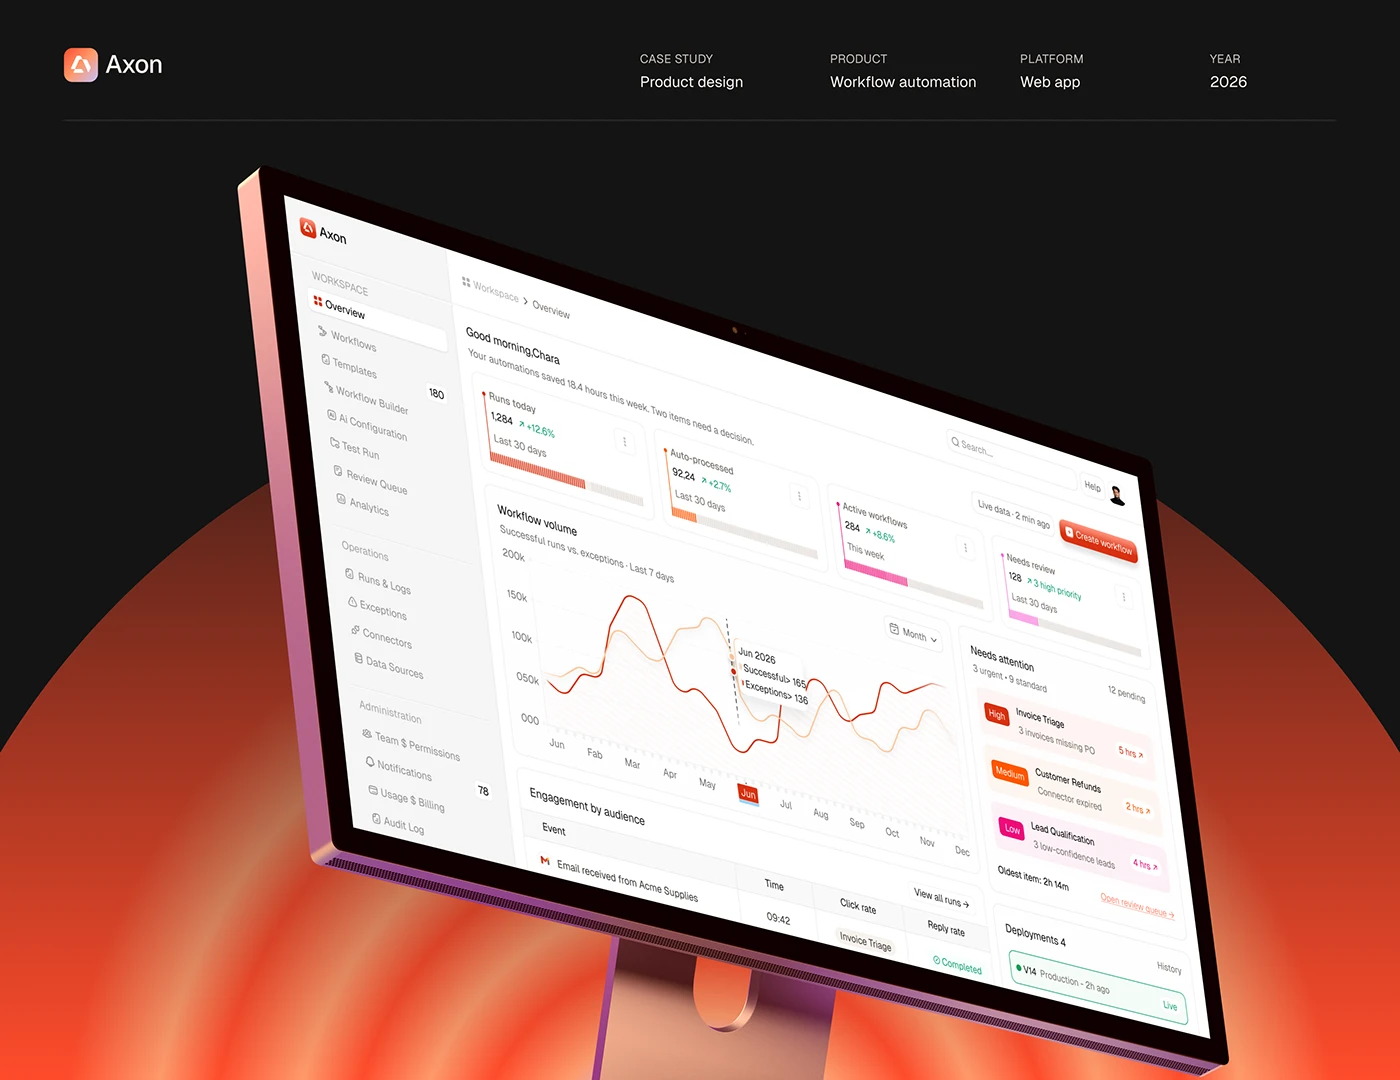
This CRM dashboard design case study covers Alignify, a sales CRM that gives sales teams a real-time view of performance. It brings customer management, order tracking, product inventory and revenue analytics into one product. I designed the web dashboard, a mobile view of it and the design system behind both.
The challenge
Sales teams were tracking their numbers across too many places, so the dashboard had to pull everything into one view.
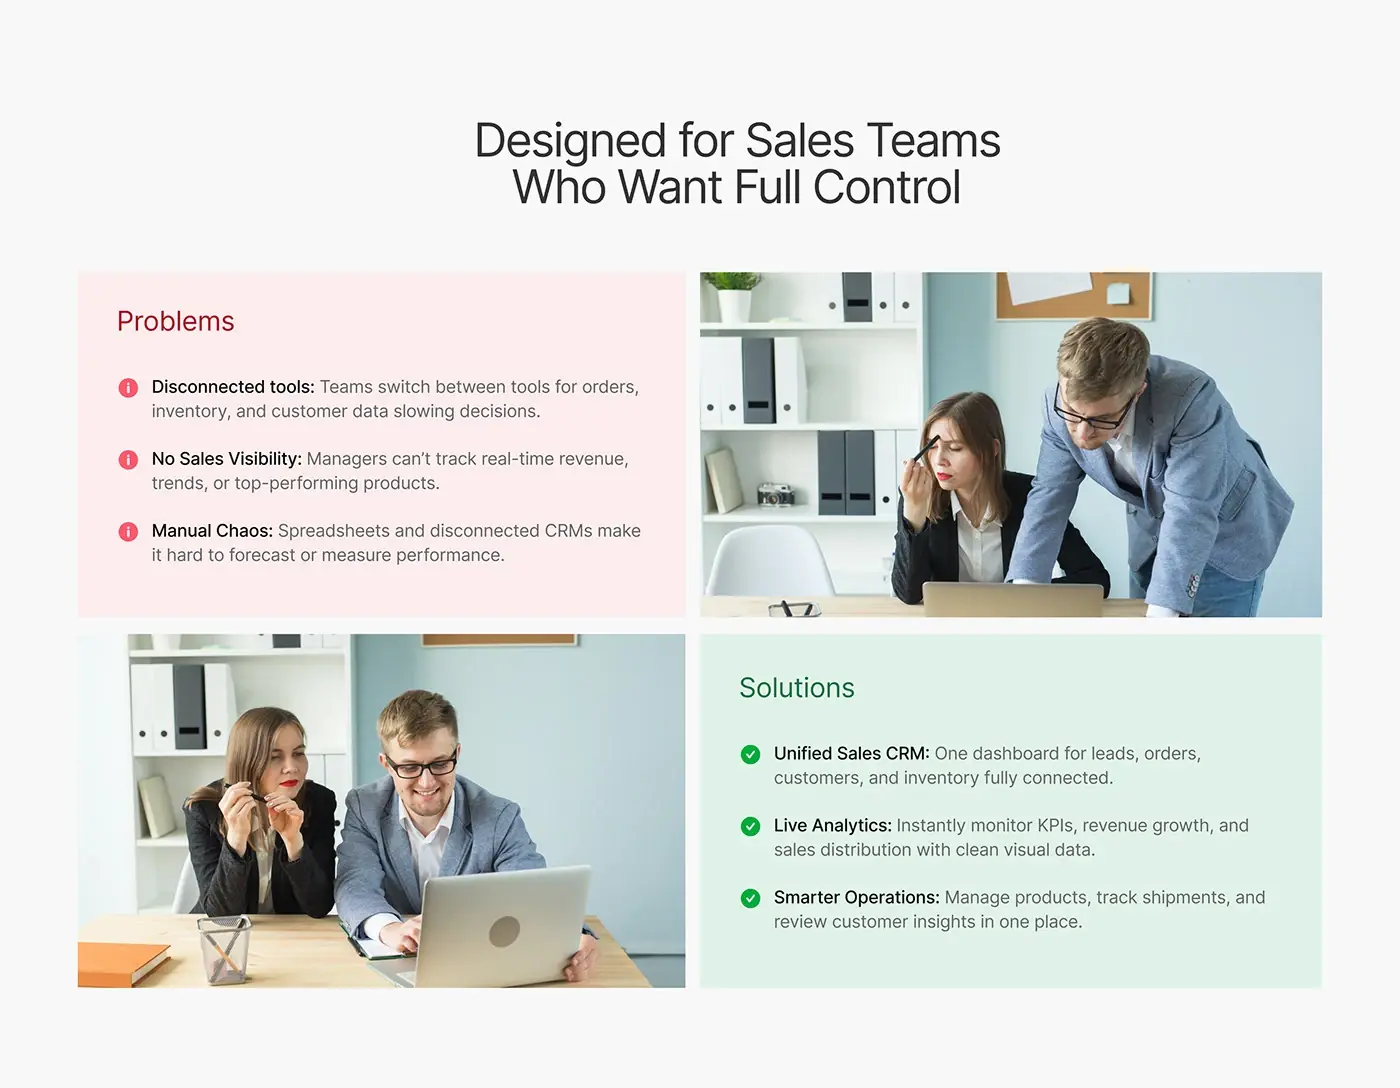
- Teams switch between tools for orders, inventory and customer data, which slows decisions.
- Managers can't track live revenue, trends or top-selling products.
- Spreadsheets and separate CRMs make it hard to forecast or measure performance.
The deck answers each one: a single CRM for leads, orders, customers and inventory, live analytics for KPIs and revenue, and products, shipments and customer insight managed in one place.
The process
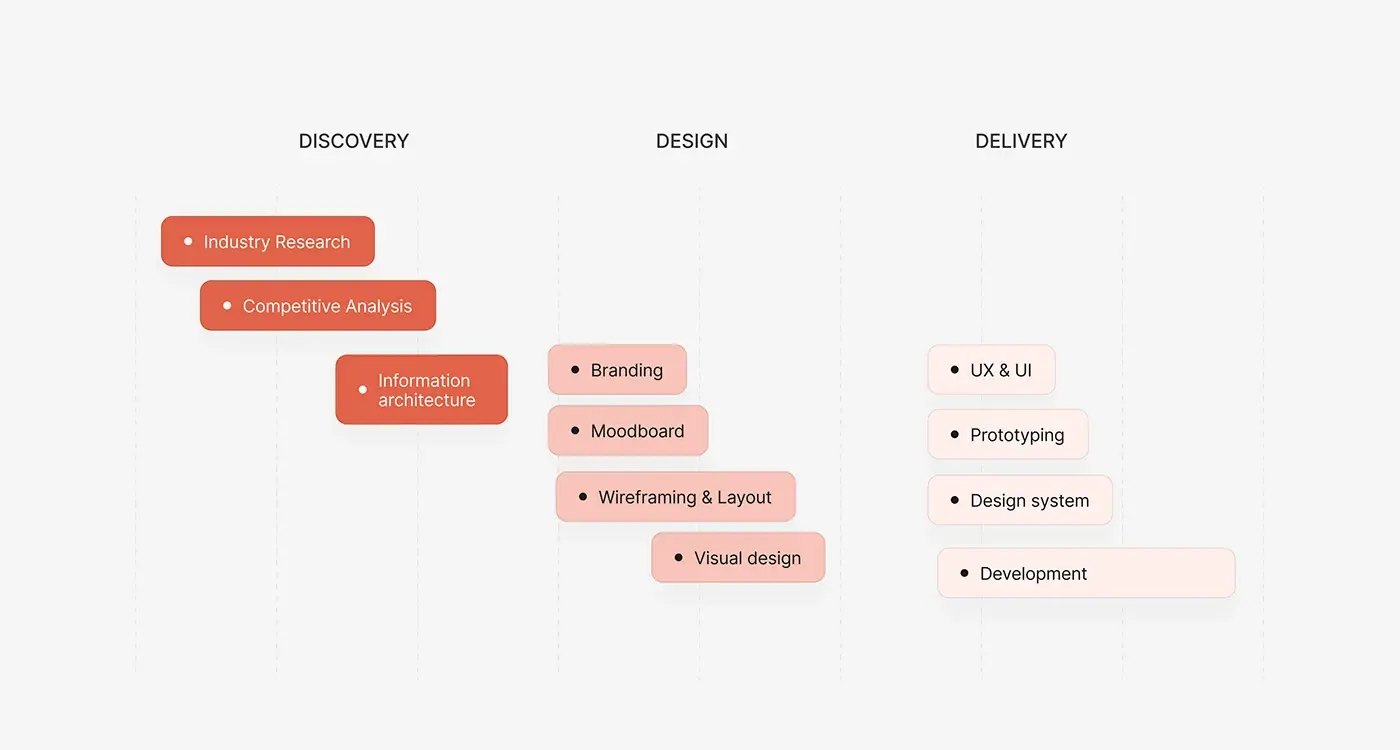
- Discovery: industry research, competitive analysis and information architecture.
- A moodboard, then wireframes and layout.
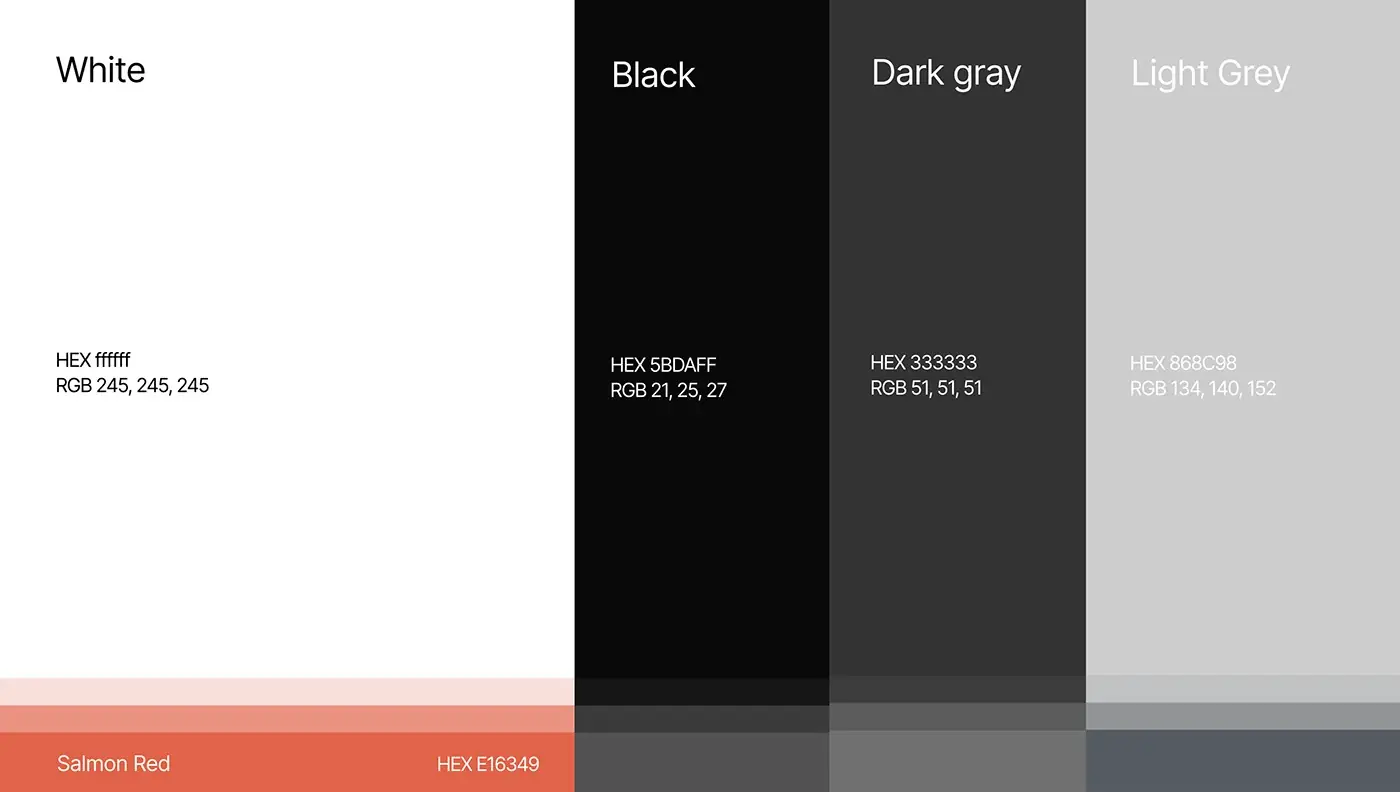
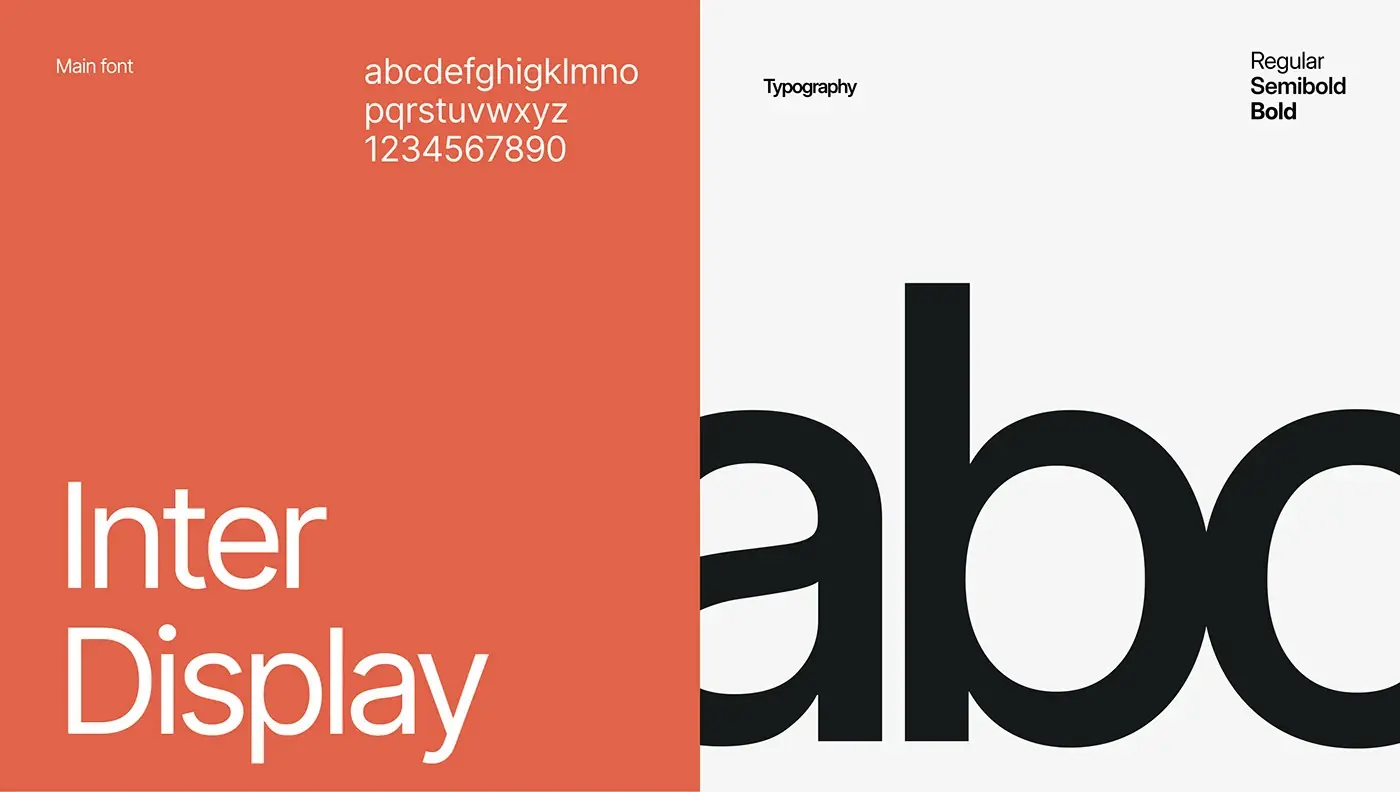
- Visual design, with Inter Display and a salmon red accent on greys.
- UX and UI for every screen, a prototype and a design system.
The solution
The dashboard puts the numbers a sales lead checks first at the top, and keeps everything else one click away.
Main dashboard
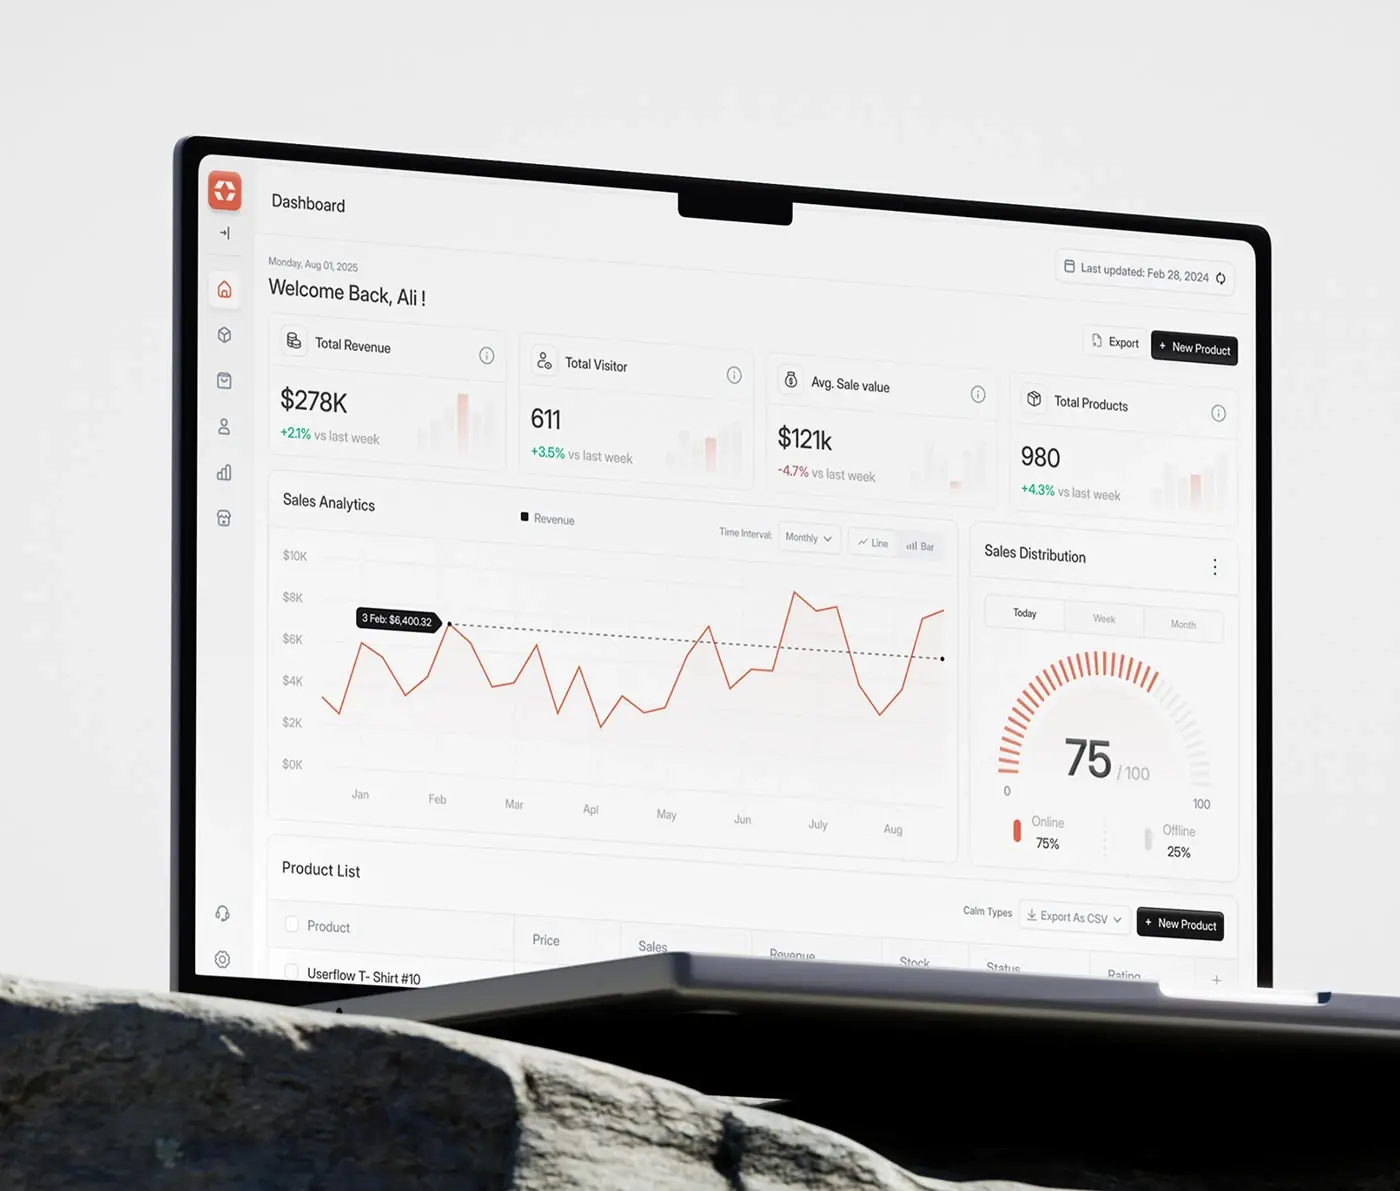
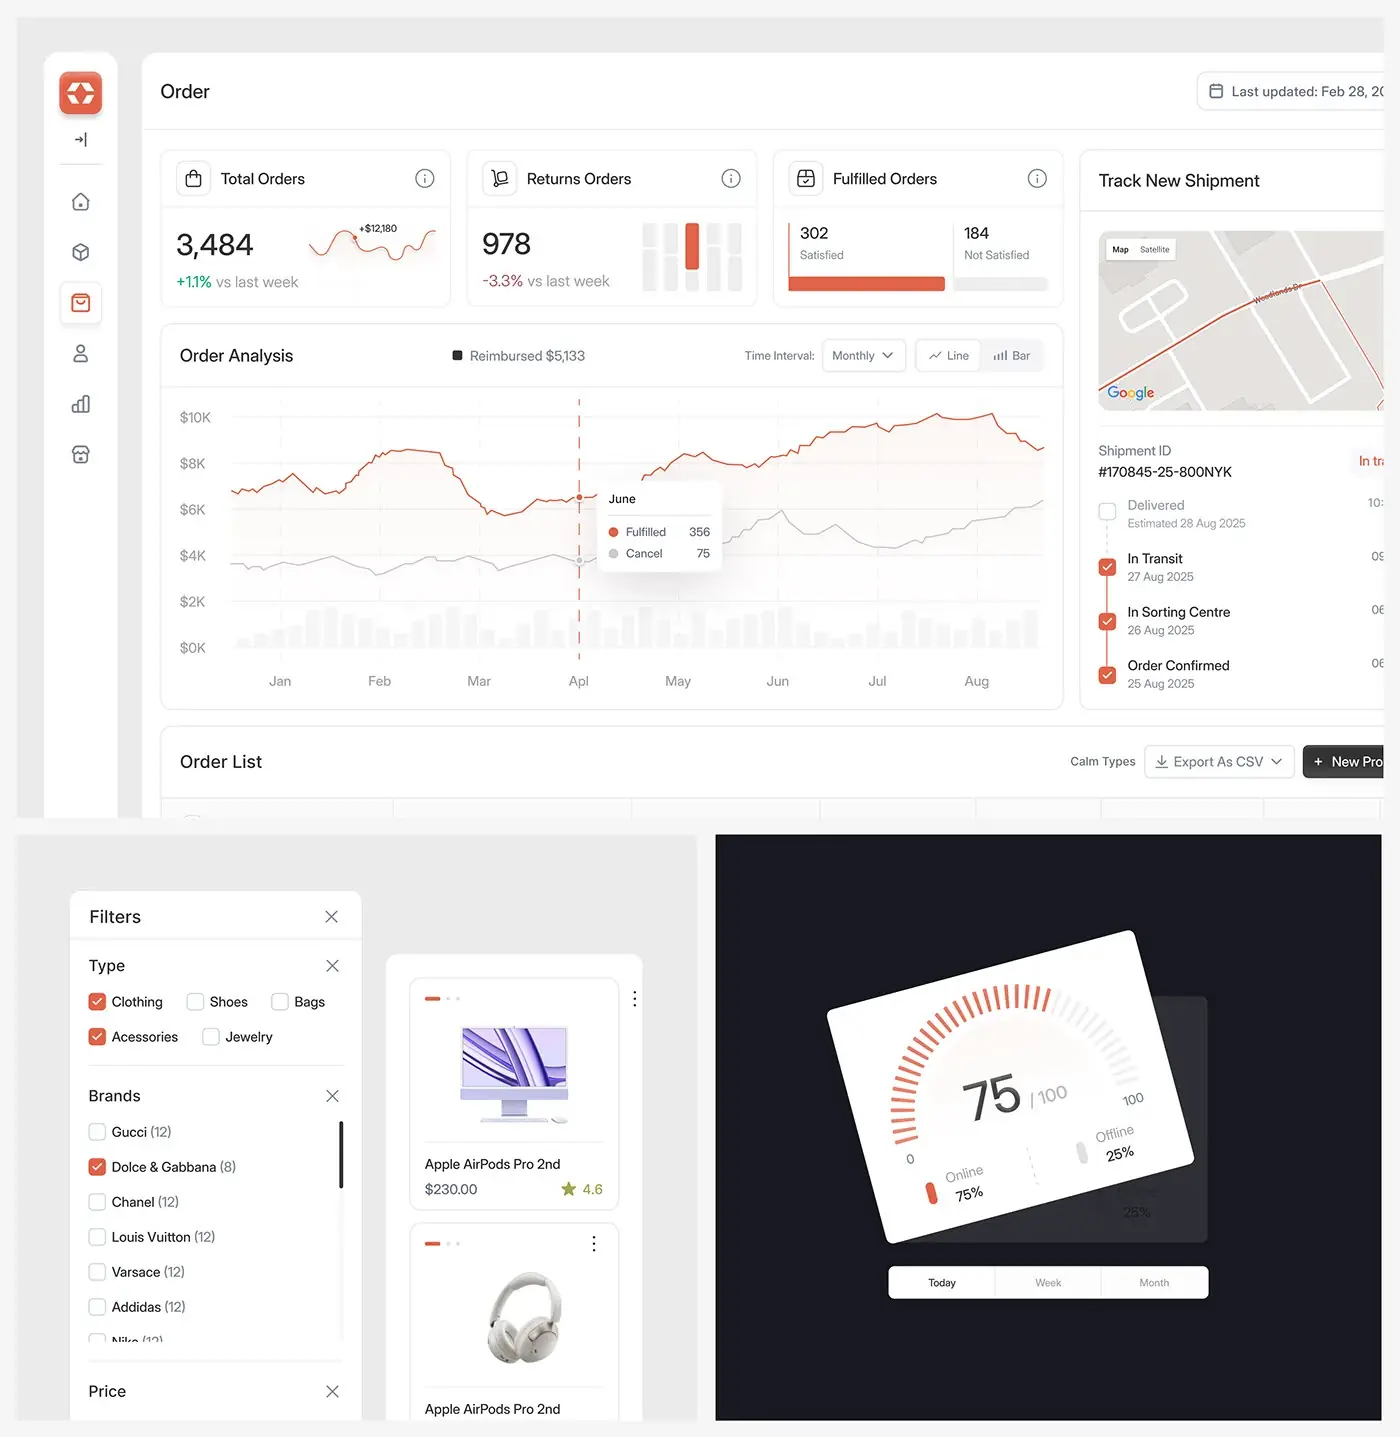
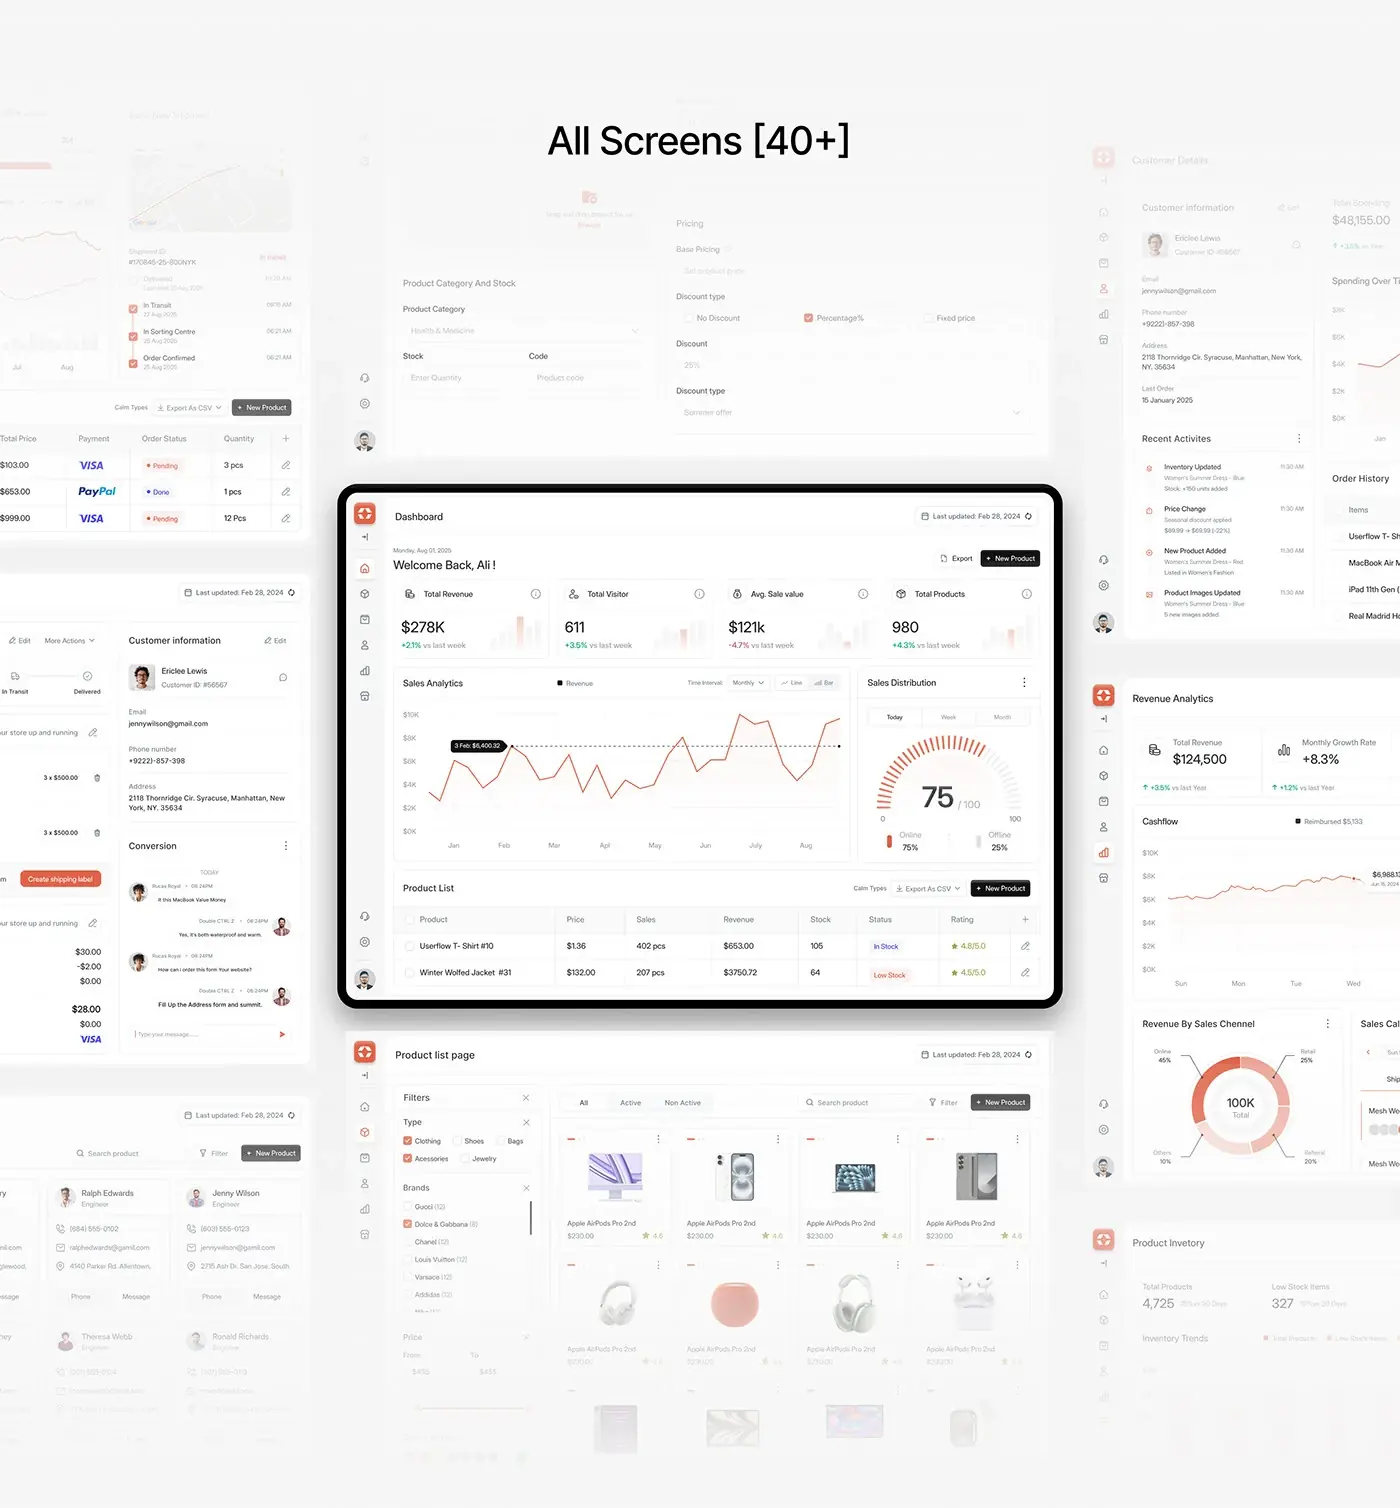
A greeting with the date and a last updated stamp sits above four KPI cards: total revenue, visitors, average sale value and products, each with its change against last week. A sales analytics chart with a monthly interval and a line or bar toggle sits beside a gauge splitting online and offline sales, with today, week and month tabs. A product list with stock status and rating closes the screen.
Orders and shipment tracking
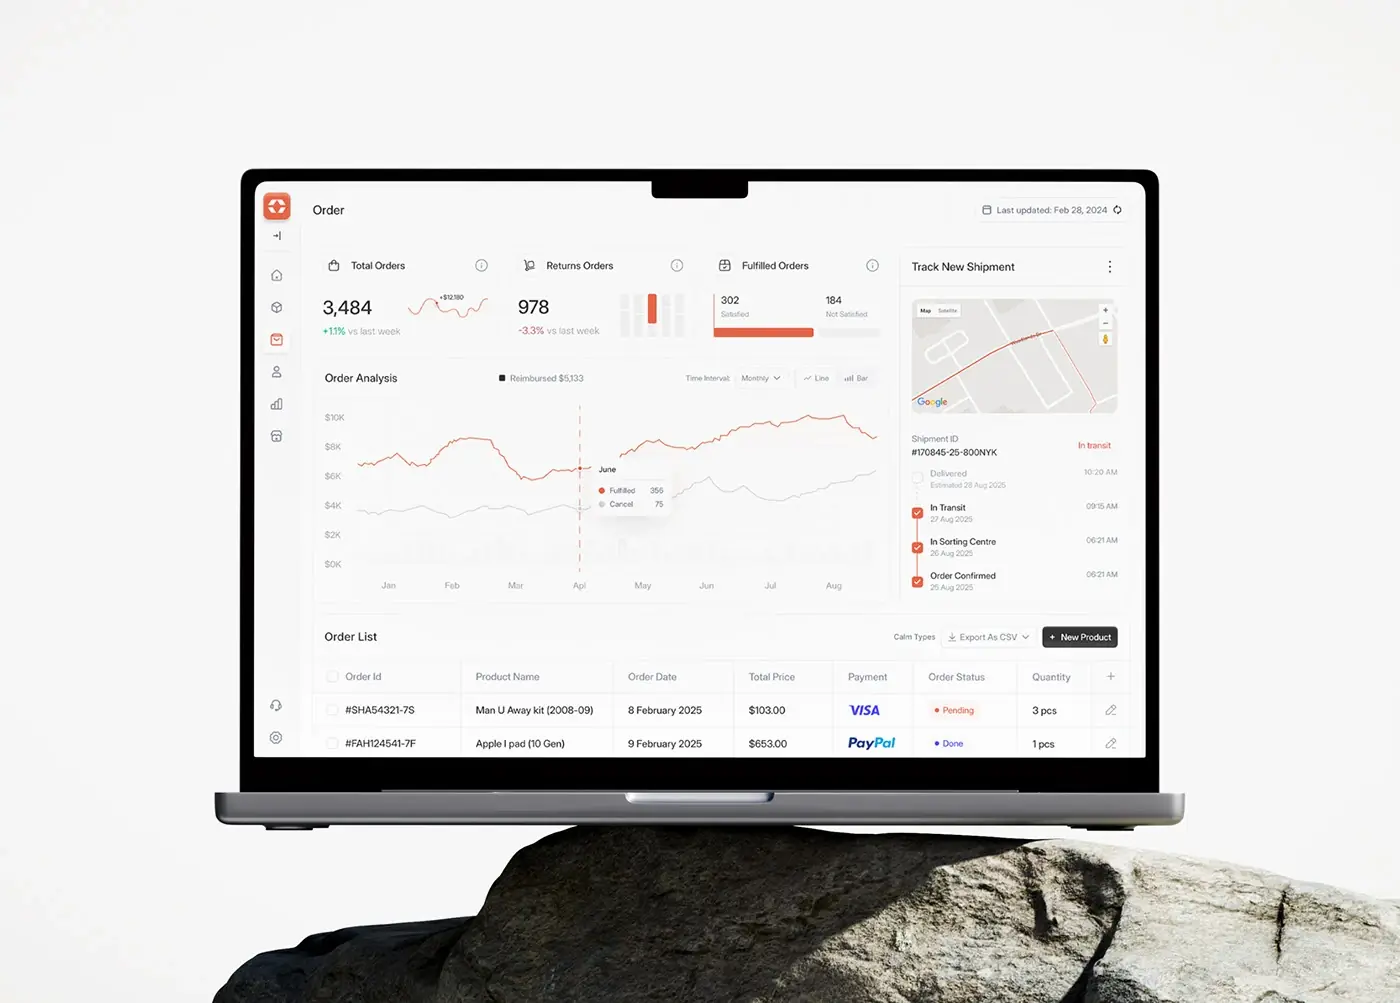
The order page opens on total, returned and fulfilled orders, with fulfilled split into satisfied and not satisfied. An order analysis chart plots fulfilled against cancelled orders by month. Beside it, a shipment tracker shows a map and four status steps from order confirmed to delivered. The order list below has payment method, status, quantity and CSV export.
Order details and customer chat
An order's page shows its status steps, line items, a Create shipping label button and the payment summary. The customer's details sit beside it, with a conversation thread underneath, so a question about an order gets answered on the same screen as the order, not in a separate inbox.
Products and inventory
The product page has a filter panel for type, brand (with counts) and price, tabs for all, active and inactive products, and a card grid with price and rating. The product form covers category, stock, code, base price and discount type. Inventory shows total products and low stock items above an inventory trend chart, so restocking starts from a number, not a guess.
Customers
Customer cards give name, role, phone, email and address with Phone and Message buttons. A customer's own page adds total spending, a spending chart, recent activity and order history, so a sales rep sees the relationship before picking up the phone.
Revenue analytics
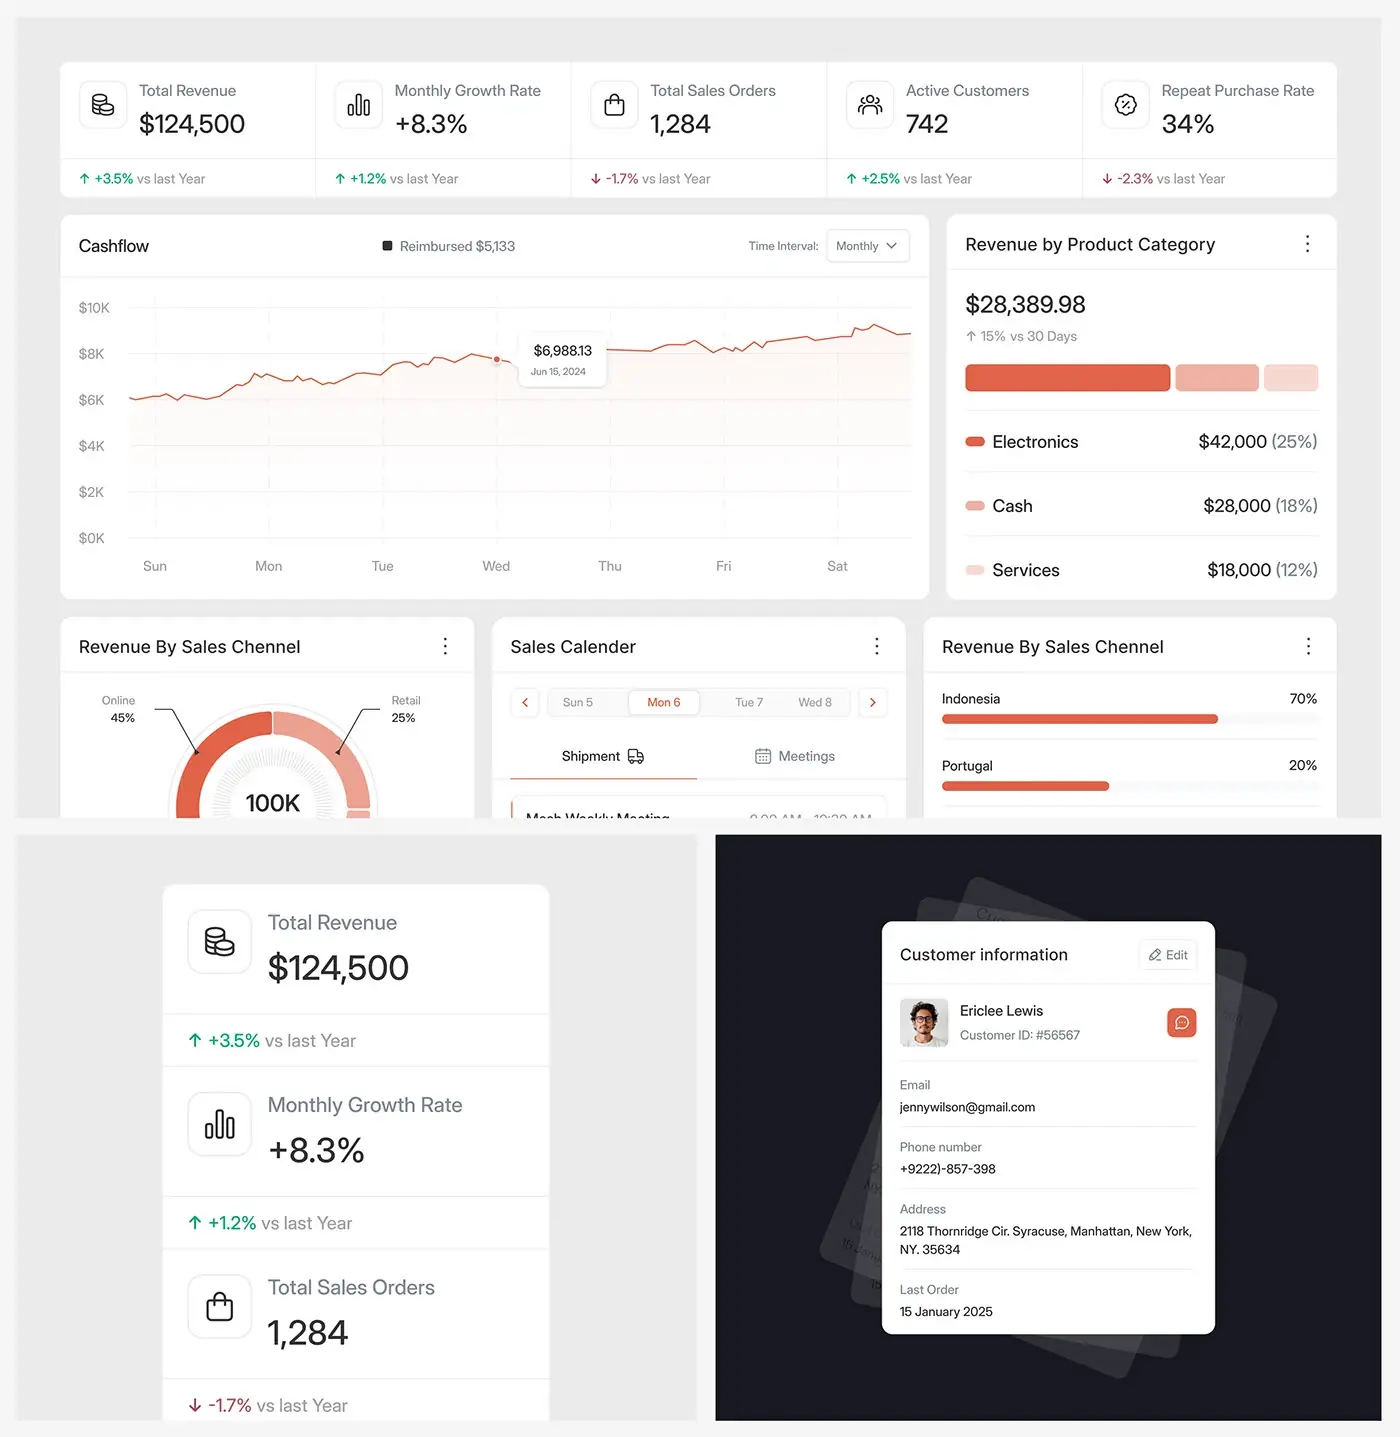
Five cards lead: total revenue, monthly growth rate, total sales orders, active customers and repeat purchase rate, each against last year. A cashflow chart sits beside revenue by product category. Below come revenue by sales channel as a ring (online, retail, referral and others), revenue by country and a sales calendar with shipment and meeting tabs.
Mobile view
The mobile view stacks the KPI cards in one column, revenue first, then visitors and average sale value, each with its weekly change and a small bar chart. A manager on the move gets the same numbers in the same order as on the desktop.
The result
- The web dashboard: overview, orders, products, inventory, customers and revenue analytics, which the deck lists as 40+ screens.
- A mobile view of the dashboard's KPI cards.
- A design system with Inter Display, salmon red and a grey scale, plus a prototype.
How it helps the client
The design lets a sales manager check revenue, orders and stock in one place instead of jumping between tools, with the numbers they check first already on screen. That's the aim of my product design for SaaS dashboards: the answer on screen before the question. More of that thinking is in my SaaS case studies.