

Overview
OpsLoop is a micro-task platform that connects teams with reliable workers for labelling, QA and content tasks. This micro-task platform design covers both sides of the web app: teams post, assign and approve work, and workers find tasks, submit them and get paid. I designed every screen on both sides, shown on tablet, plus the grid, type and colour behind them.
The challenge
Two-sided products fail when one side is an afterthought, so I looked at teams and workers separately.
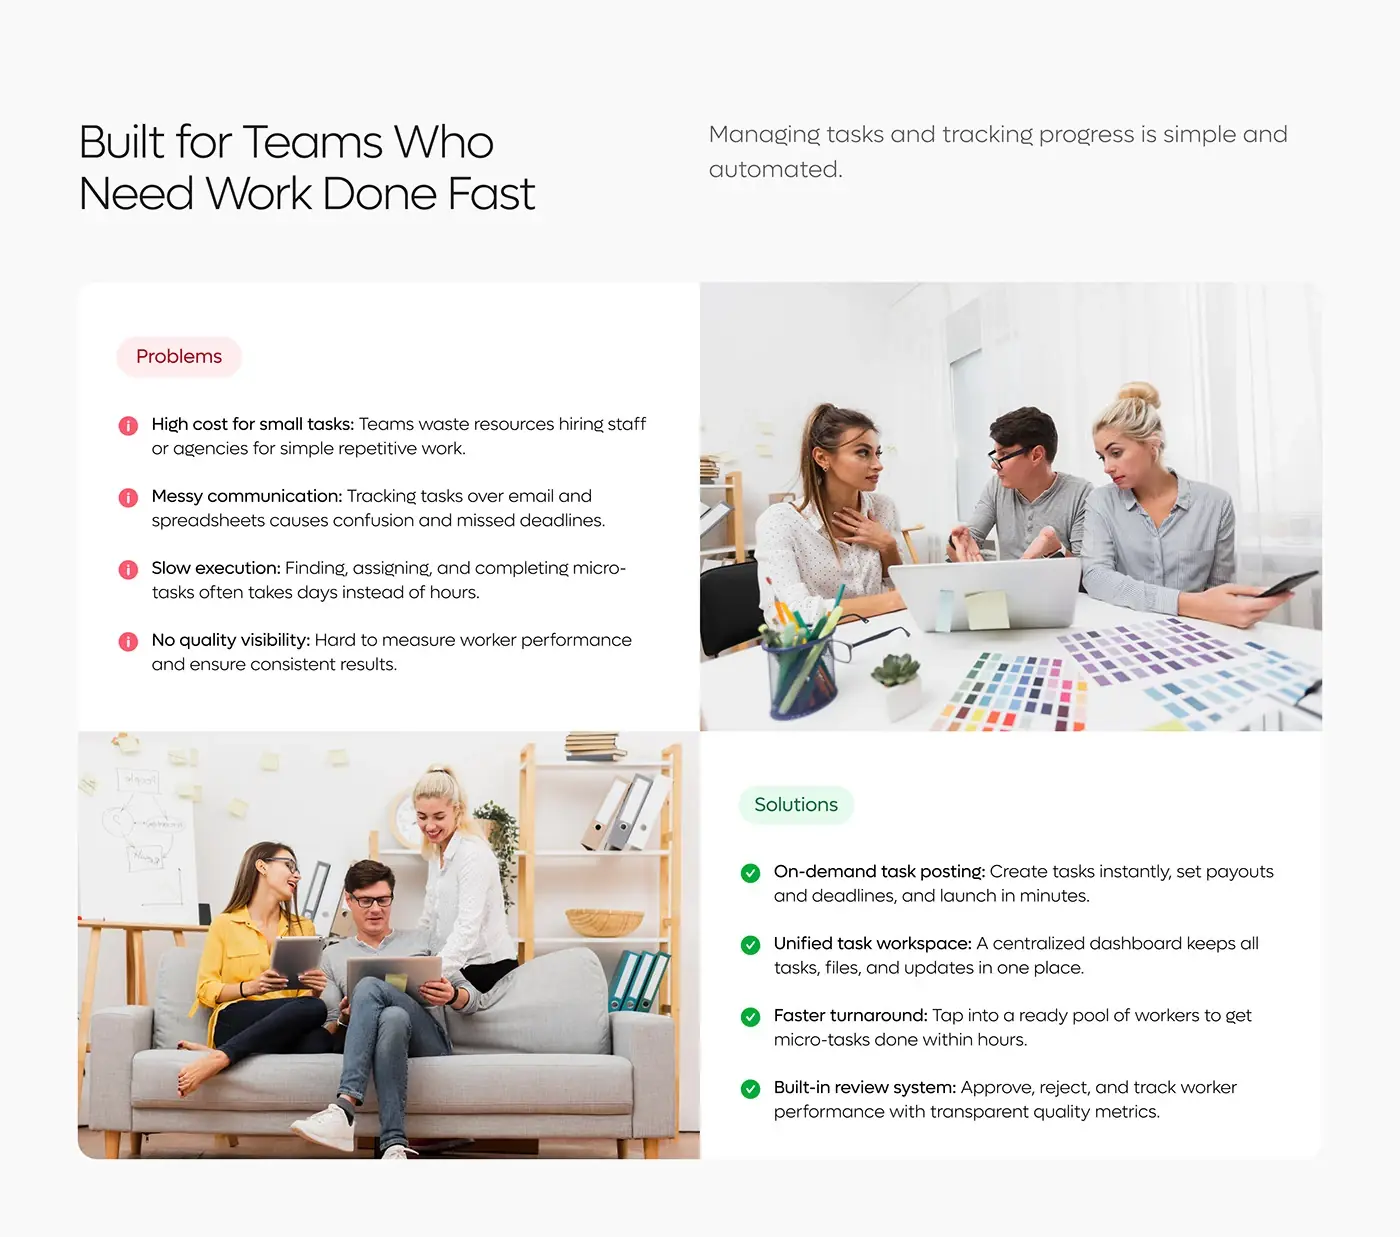
- Teams pay staff or agencies for simple, repetitive work, and a micro-task can take days instead of hours.
- Teams track small tasks over email and spreadsheets, and deadlines slip.
- Teams find it hard to measure worker performance.
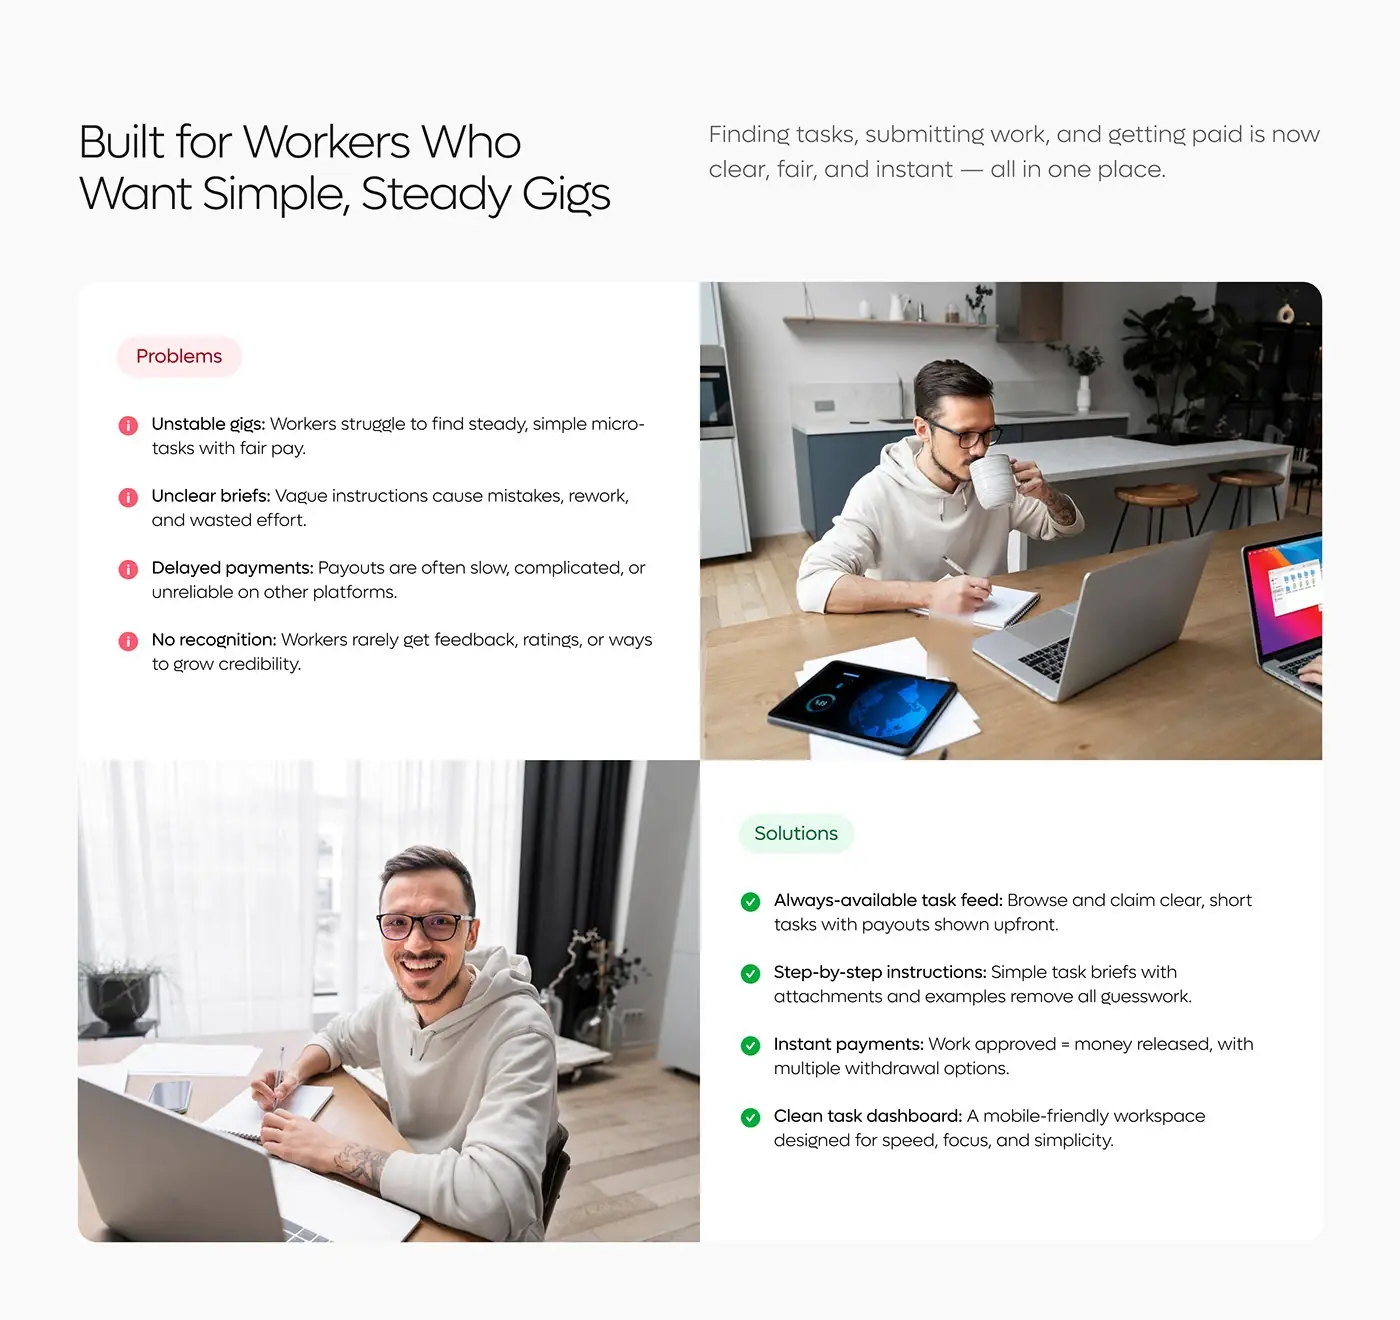
- Workers struggle to find steady, fairly paid tasks, and vague briefs cause rework.
- Payouts elsewhere are often slow, and good work rarely earns feedback or credit.
The process
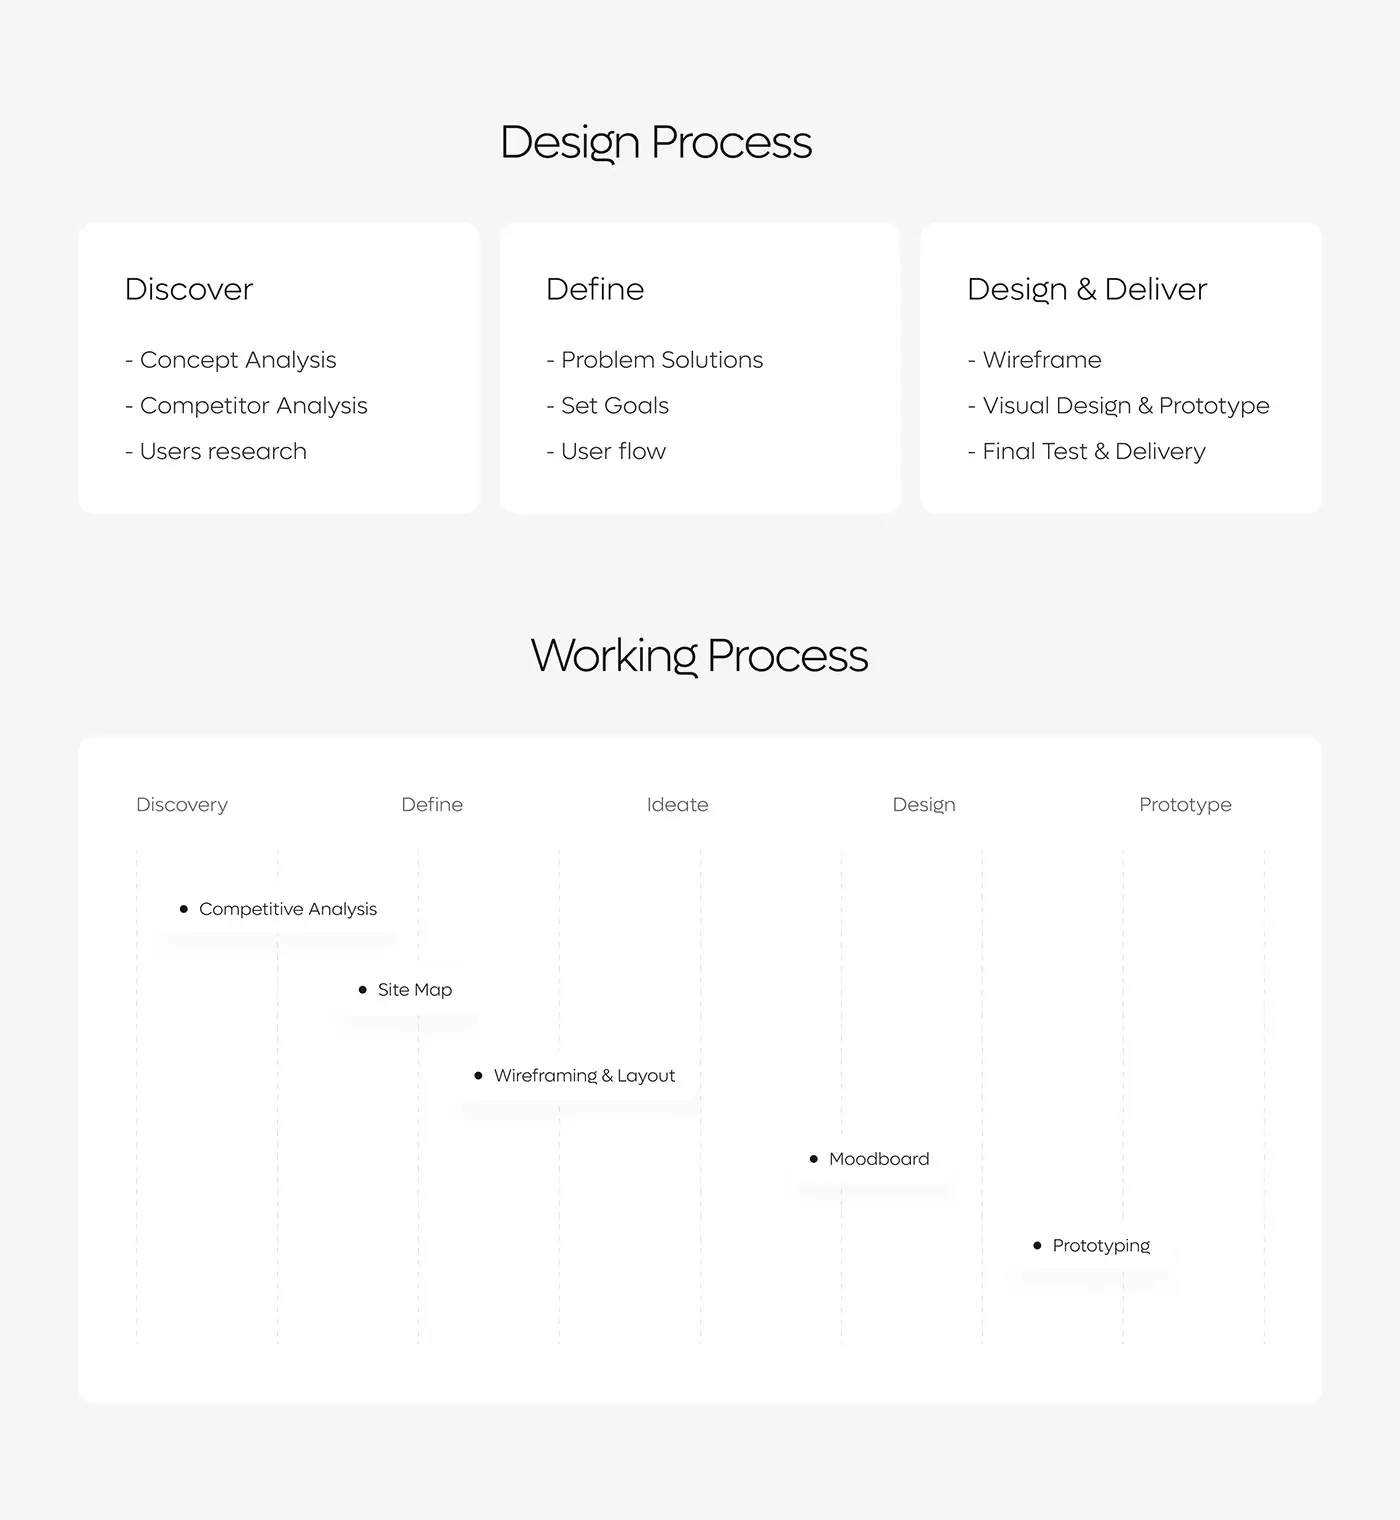
- Discover: concept and competitor analysis, and user research.
- Define: problems and solutions for each side, goals and the user flow.
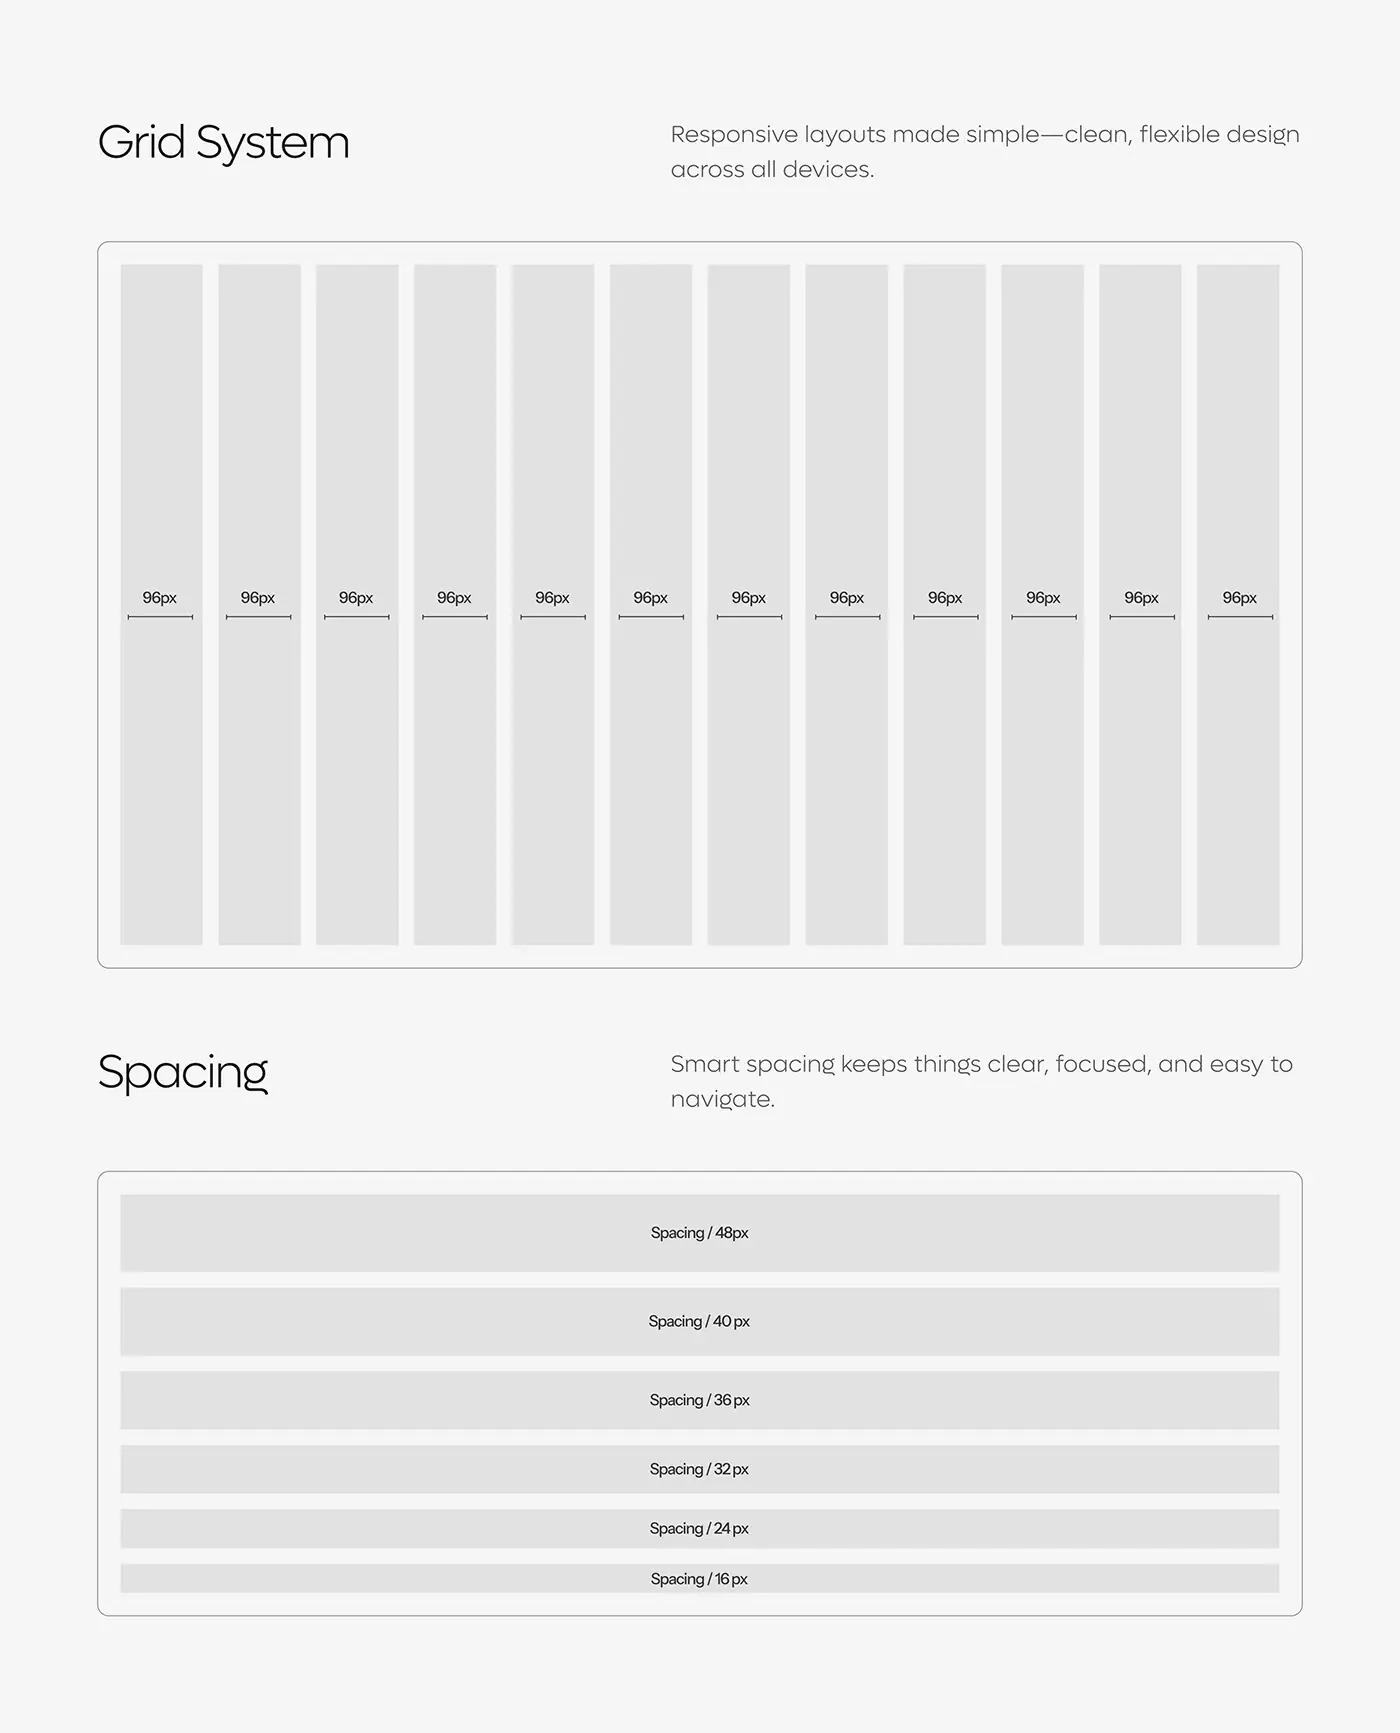
- Site map, wireframes and layout on a 12 column grid with a 16 to 48px spacing scale.
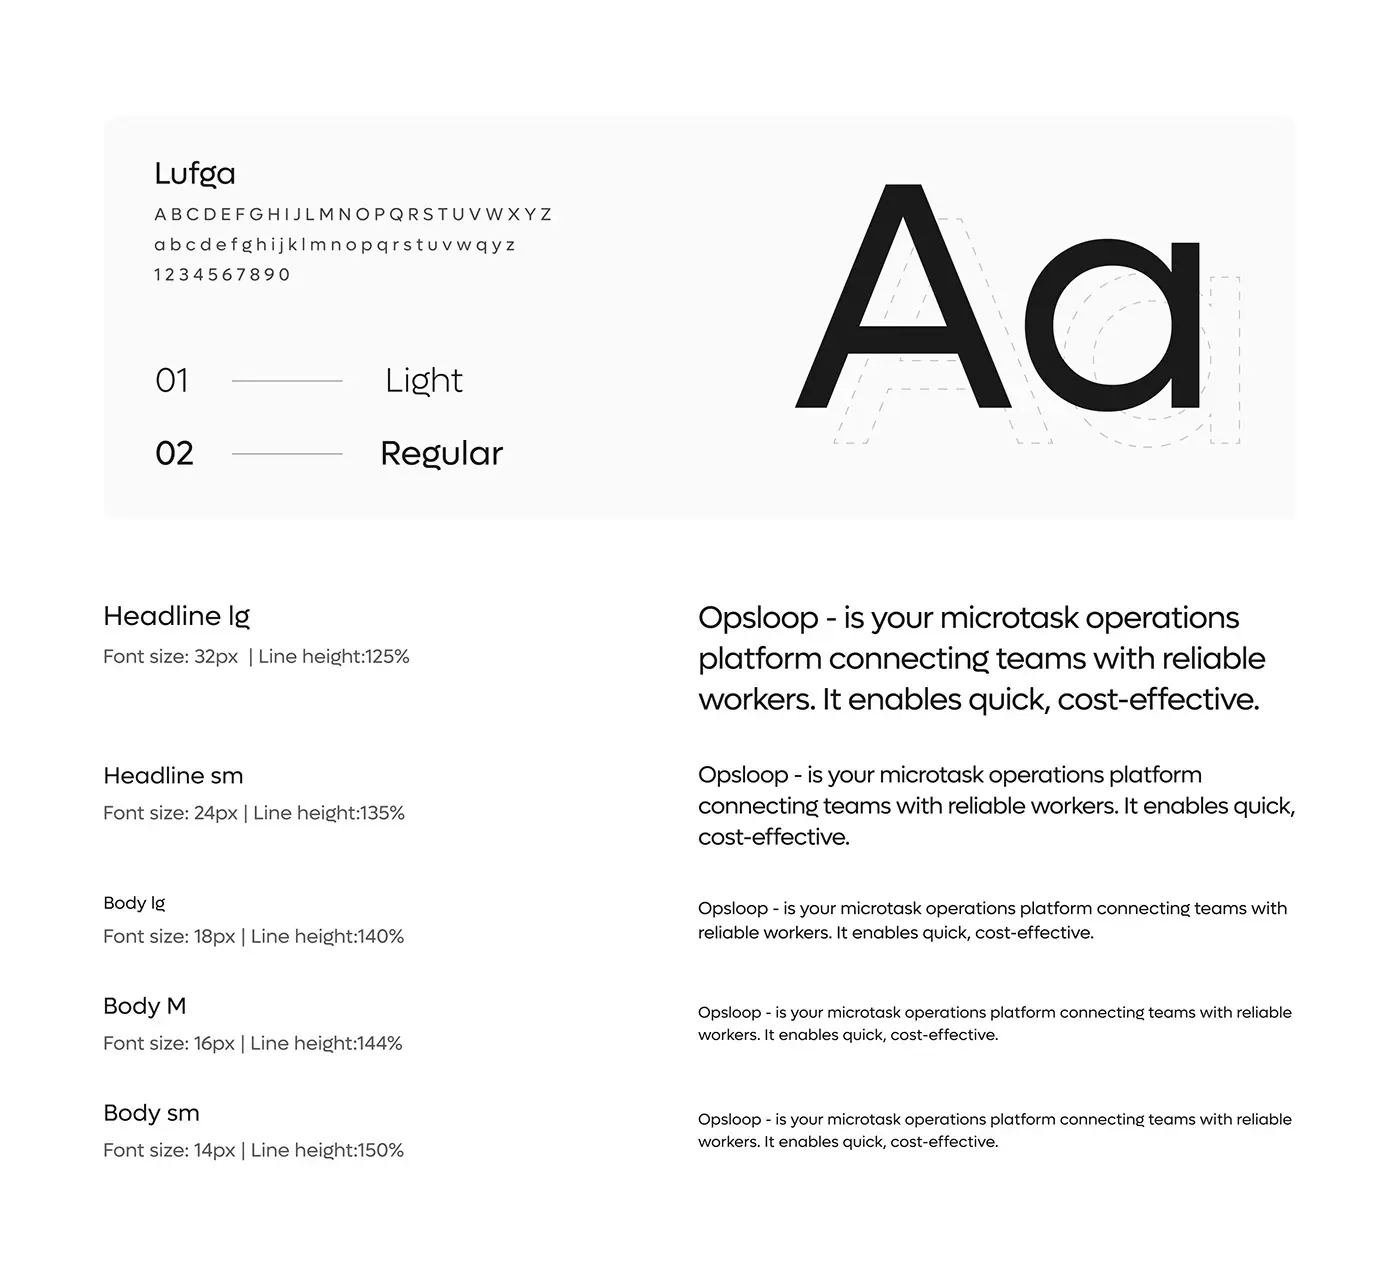
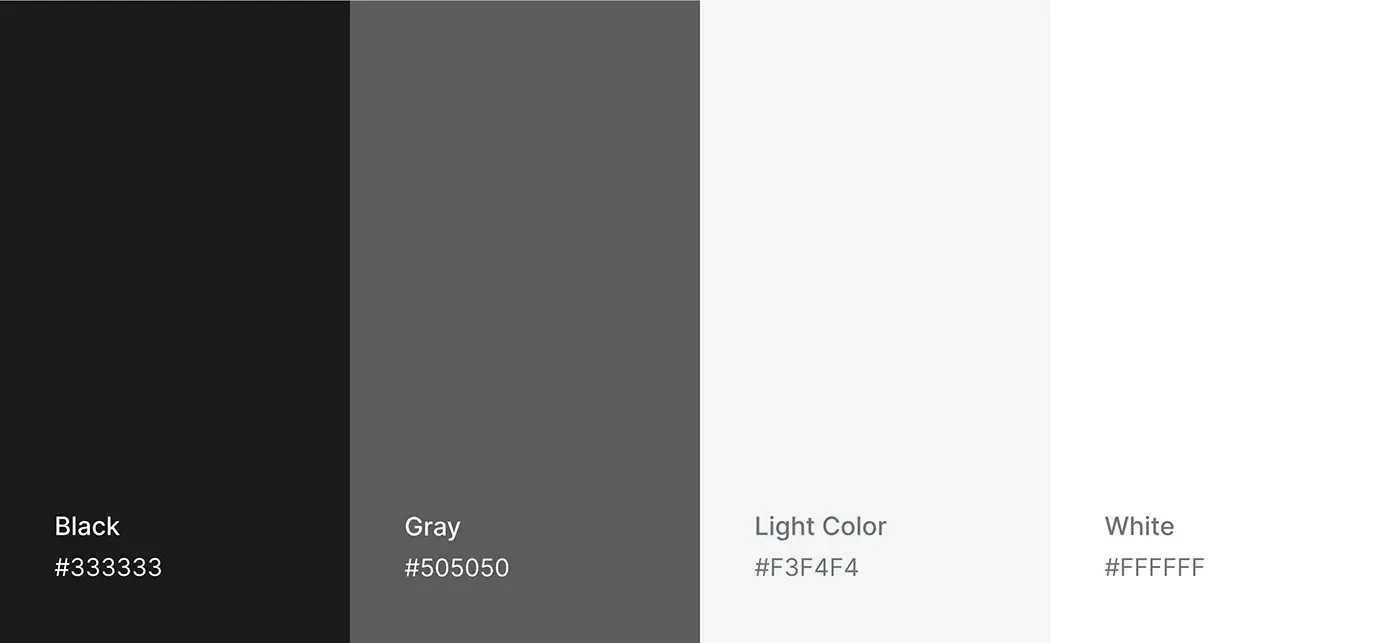
- Moodboard, then visual design: Lufga in Light and Regular and a greyscale palette.
- Prototype, final test and delivery.
The solution
Both sides share one loop: a team posts a task, a worker claims and submits it, that team reviews it and the worker gets paid. Each side has its own top navigation.
Team dashboard
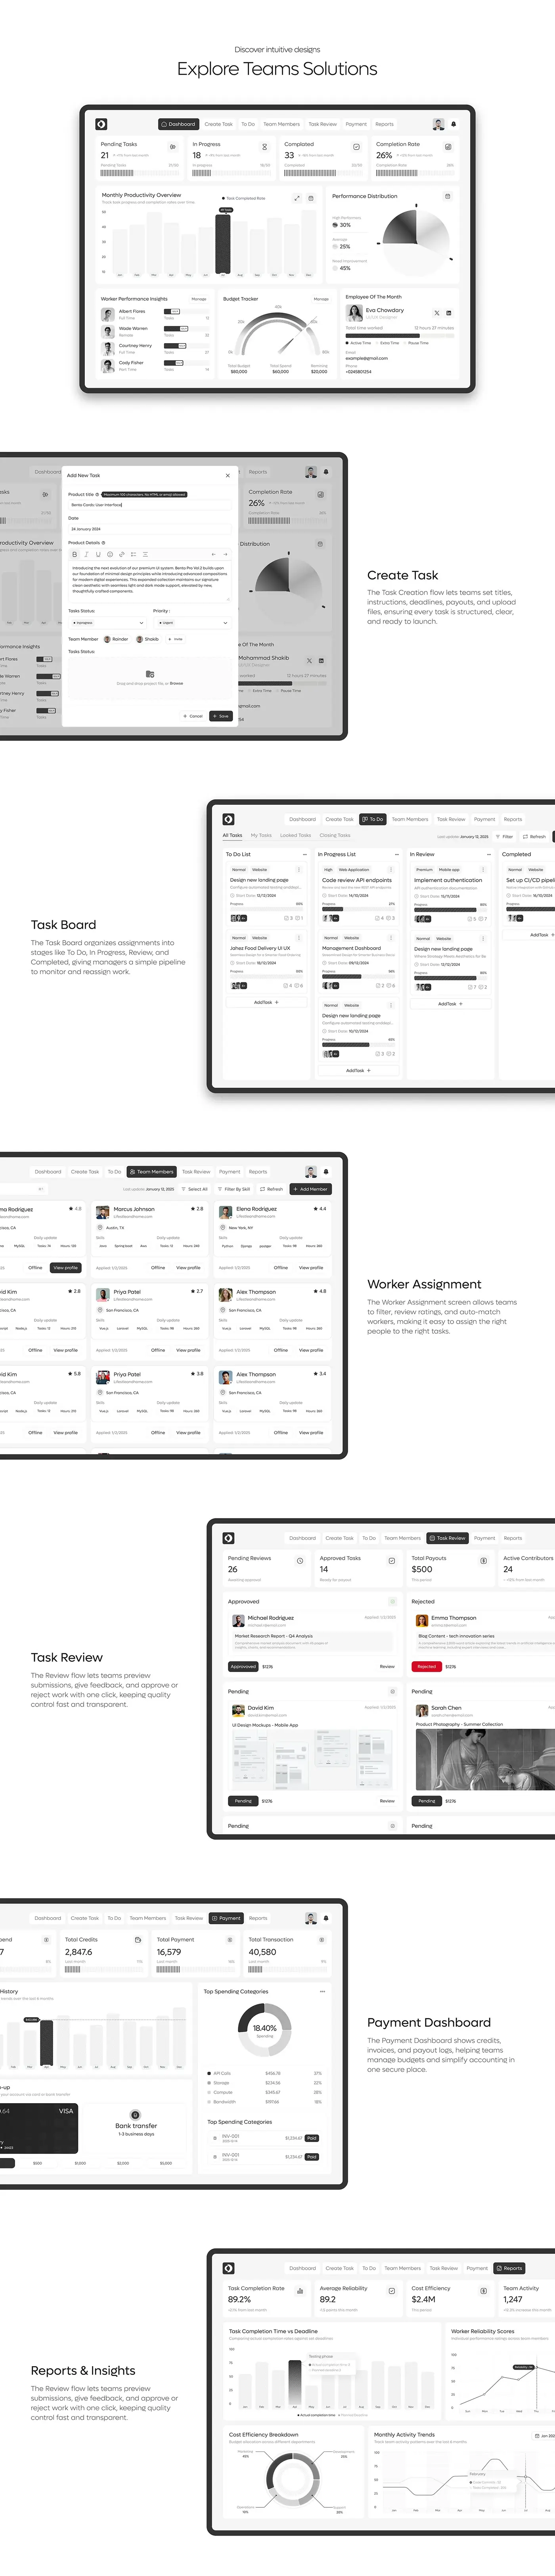
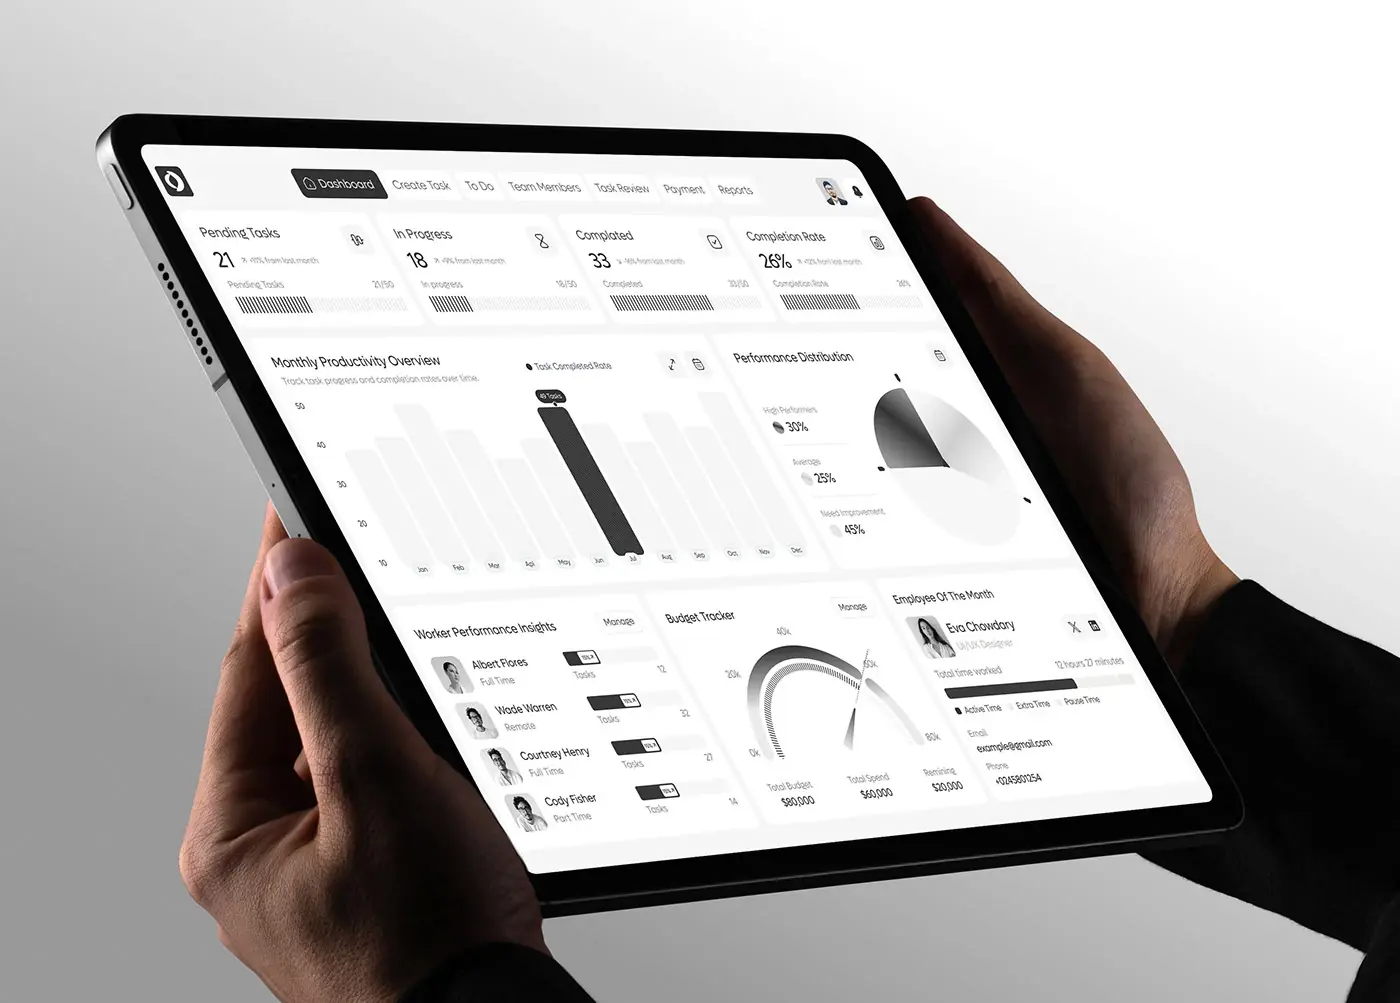
Four counters open the screen: pending tasks, in progress, completed and completion rate, each against last month. Below sit a monthly productivity chart, a split of high, average and low performers, worker insights, a budget tracker and an employee of the month card. What is stuck comes first; people and money next.
Create task
A modal over the dashboard holds the whole brief: title, date, rich-text instructions, status, priority, assignees and a drag-and-drop file area, plus payout and deadline. Because everything sits in one form, a task launches complete and nobody chases a missing file.
Task board
Tasks move across four columns: To Do, In Progress, In Review and Completed. Each card shows priority, task type, start date, a progress bar, assignee avatars and counts of files and comments. Managers read the pipeline left to right and reassign work without opening a card.
Worker assignment
On Team Members, workers appear as cards with photo, rating, location, skills, daily tasks and hours. Filter by skill and Add Member sit above the grid. Ratings and skills are on the card itself, so a manager can pick or auto-match the right person without opening profiles.
Task review
Pending reviews, approved tasks, total payouts and active contributors lead the page. Submissions are grouped as approved, rejected and pending; each card shows the worker, the task, a file preview and the payout. Approve or reject takes one click, so quality is checked before money moves.
Payments and reports
The payment dashboard shows credits, payments, transactions, a spending history, top-up by card or bank transfer, spending by category such as API calls and storage, and paid invoices. Reports track completion rate, average reliability, cost efficiency and activity, with completion time against deadline and worker reliability scores.
Worker dashboard
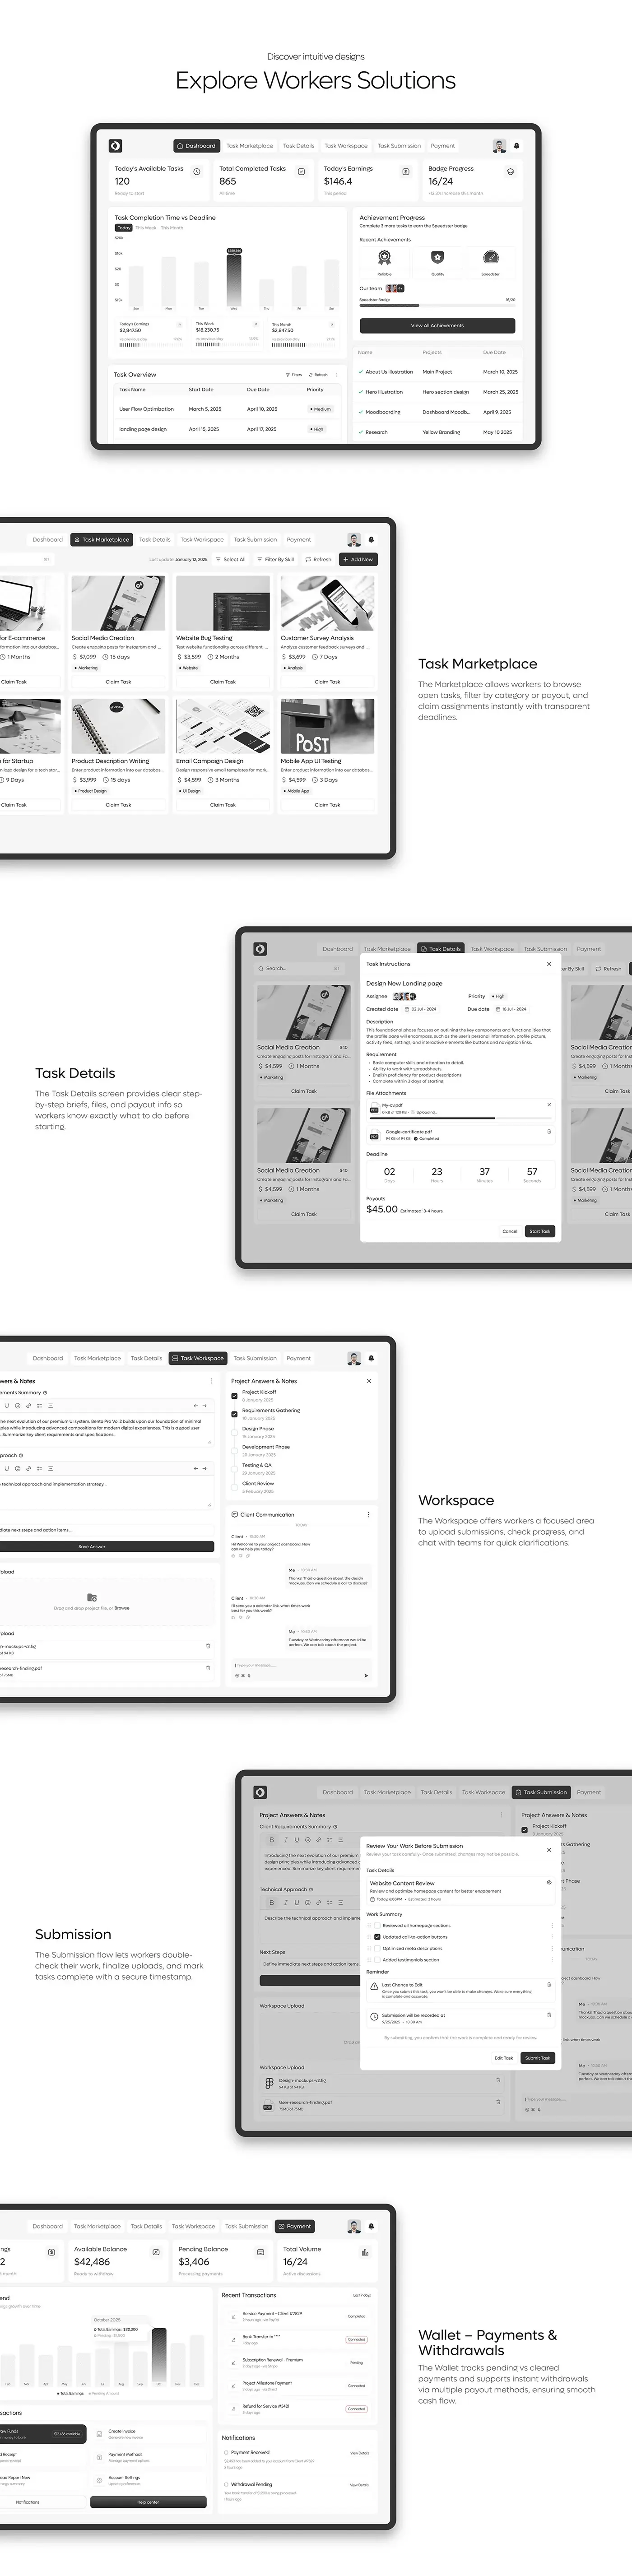
Workers open on today's available tasks, total completed tasks, today's earnings and badge progress. An achievement panel shows badges such as Reliable, Quality and Speedster and how many tasks are left to the next one. Earnings and recognition sit side by side.
Task marketplace and details
Open tasks appear as cards with an image, title, payout, time allowed, a category tag and a Claim Task button. Opening one shows a step-by-step brief: priority, dates, requirements, attached files, a live deadline countdown and the payout with an estimated time to finish. Start Task is the one strong button.
Workspace and submission
The workspace pairs answer and notes fields with a milestone checklist, file uploads and a chat with the client. Before sending, a review modal shows the task, a work summary checklist, a last chance to edit warning and the submission time, with Edit Task beside Submit Task.
Wallet
The wallet shows available balance, pending balance and total volume, an earnings chart, recent transactions and quick actions to withdraw funds, create an invoice or manage payment methods. Notifications confirm payments received and withdrawals in progress, so pending and cleared money never blur.
The result
- Team side: dashboard, create task, task board, team members, review, payment and reports.
- Worker side: dashboard, marketplace, task details, workspace, submission and wallet.
- A 12 column grid, a spacing scale, the Lufga type scale and a greyscale palette.
- The presentation.
How it helps the client
The design gives teams a fast way to post, assign and approve small tasks, and gives workers clear briefs and pay they can track. An approval on one side moves money on the other. More of this work is in my SaaS case studies. That's how I approach product design for two-sided platforms.