
Overview
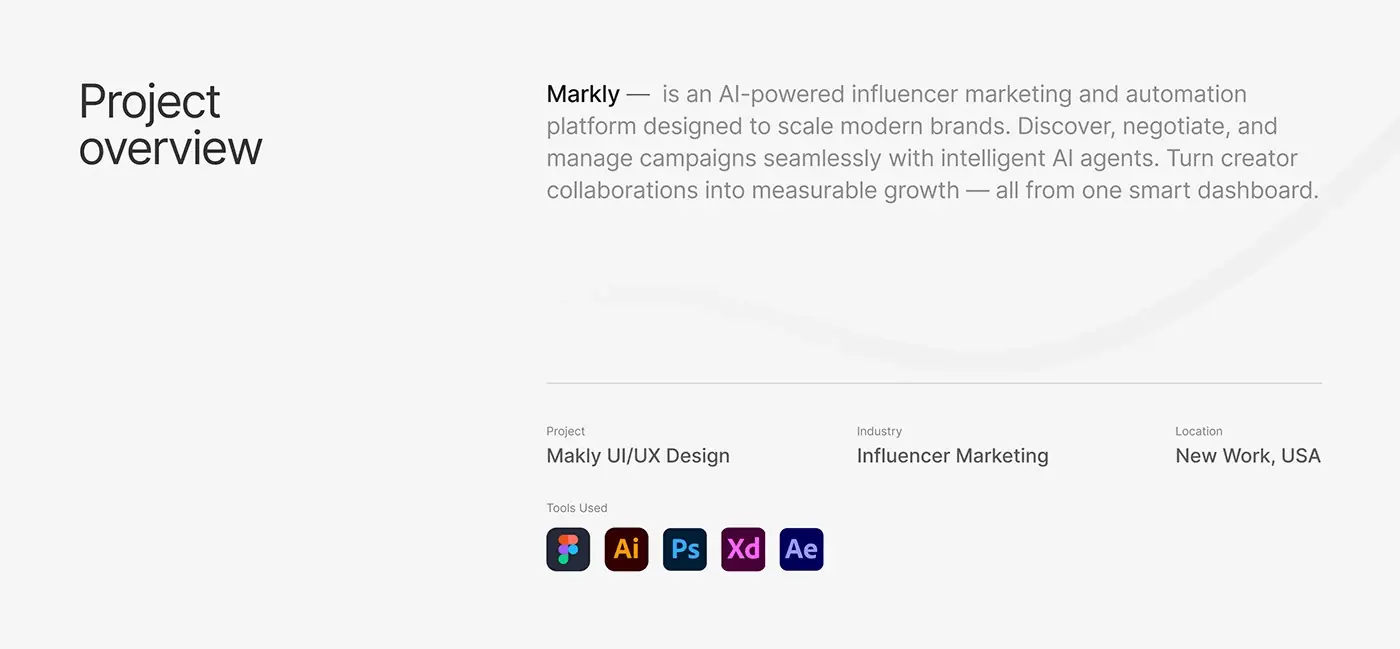
Markly is an AI influencer marketing platform: brands discover creators, negotiate and manage campaigns with the help of AI agents, all from one dashboard. This influencer marketing platform design covers more than 40 web screens and a mobile view of the dashboard, with the type, colour and components behind them. I designed every screen, from creator discovery to the approval queue where a person signs off each deal.
The challenge
Creator campaigns live in too many places, and AI agents add a new worry: what did they just do?
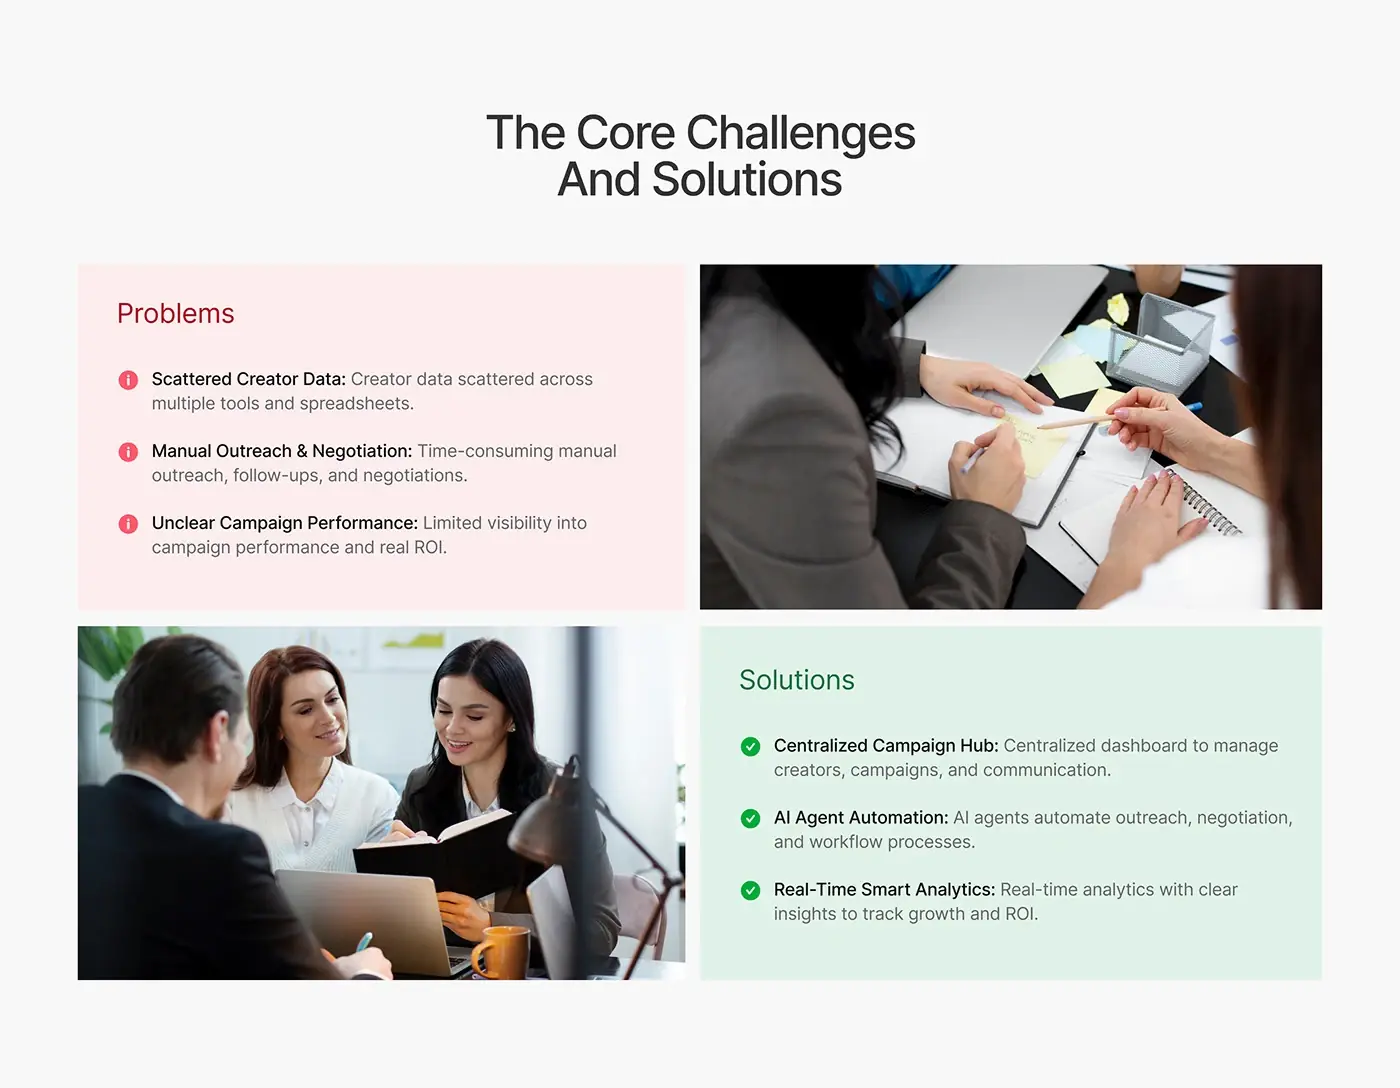
- Creator data sat scattered across tools and spreadsheets.
- Outreach, follow-ups and negotiation were slow and manual.
- Brands had little view of campaign performance and real return.
- Agents act for the brand, so every action had to be visible and easy to approve or reject.
The process
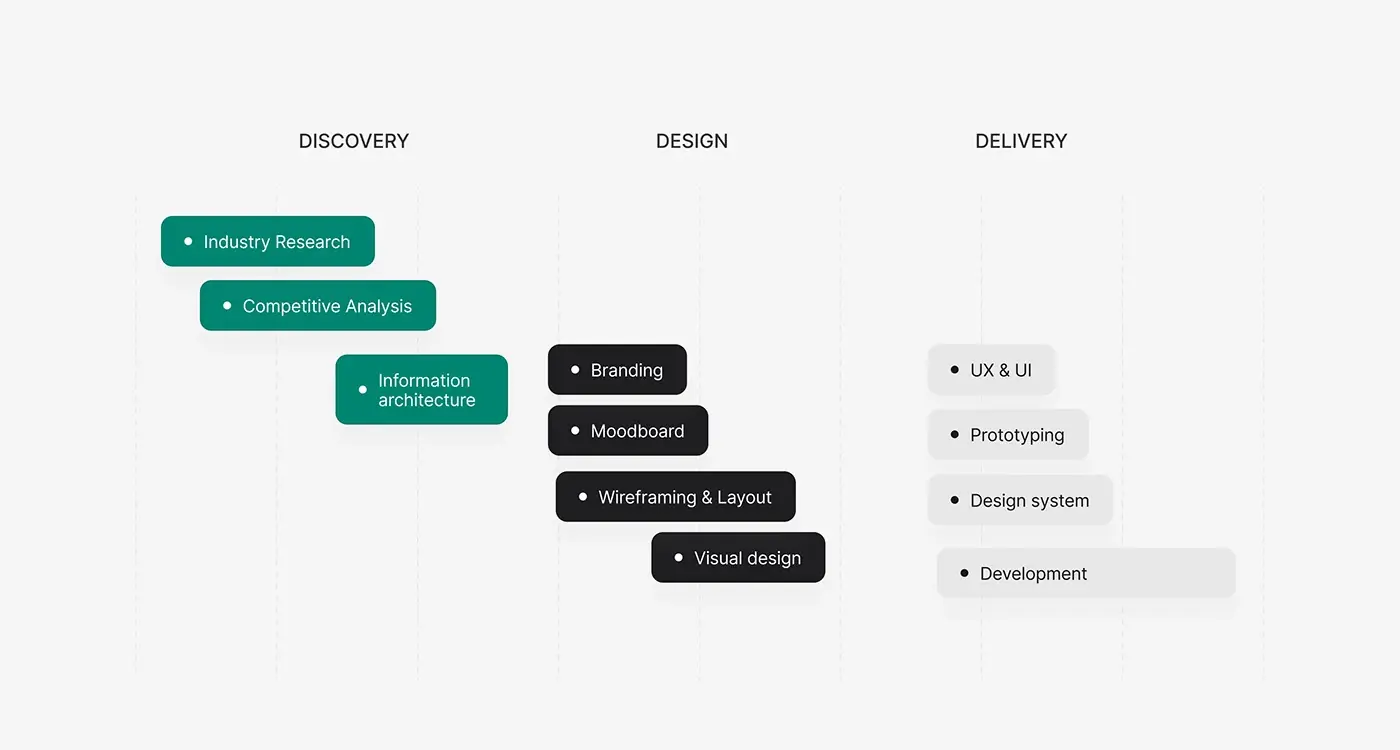
- Discovery: industry research and competitive analysis.
- Information architecture: dashboard, AI agents, discovery, outreach, approval queue, deal management and analytics.
- Moodboard, then wireframes and layout.
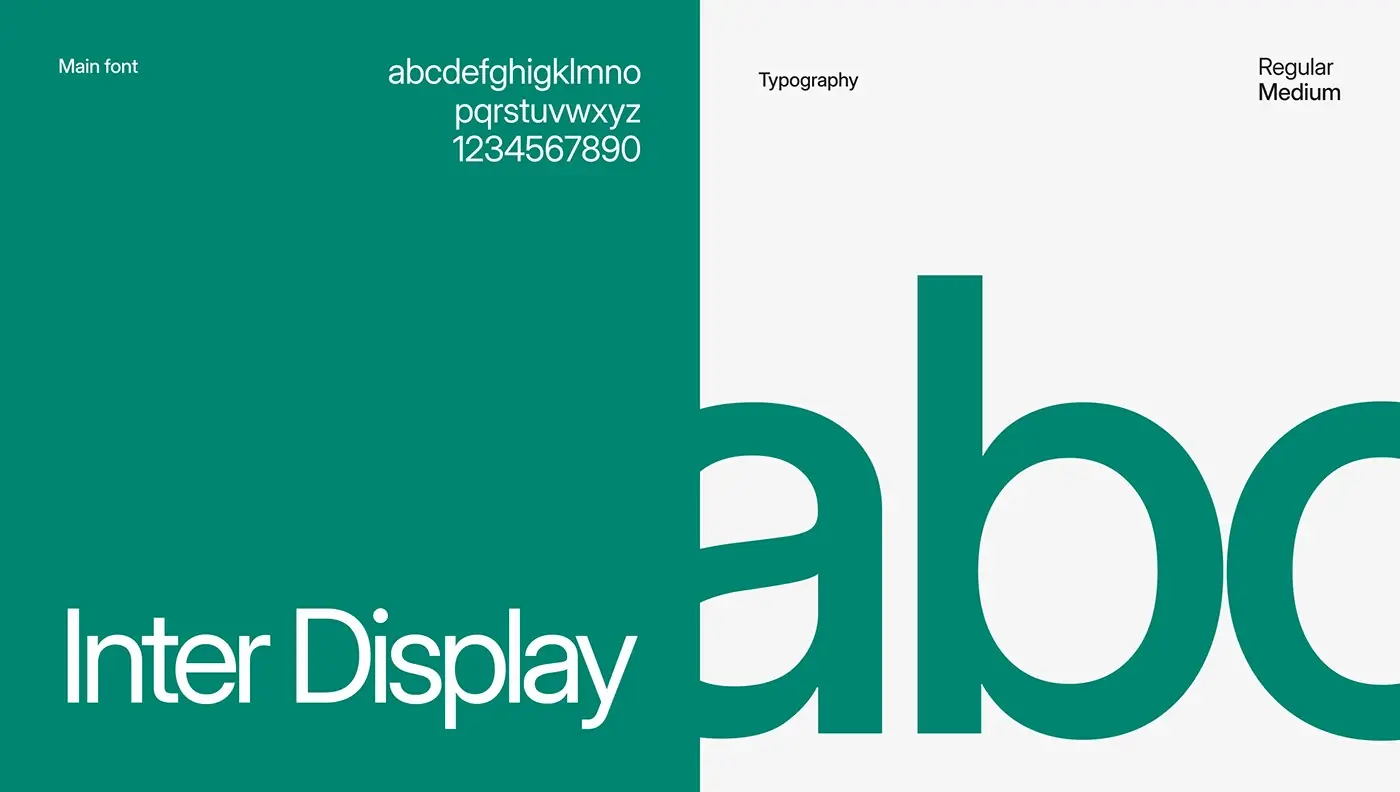
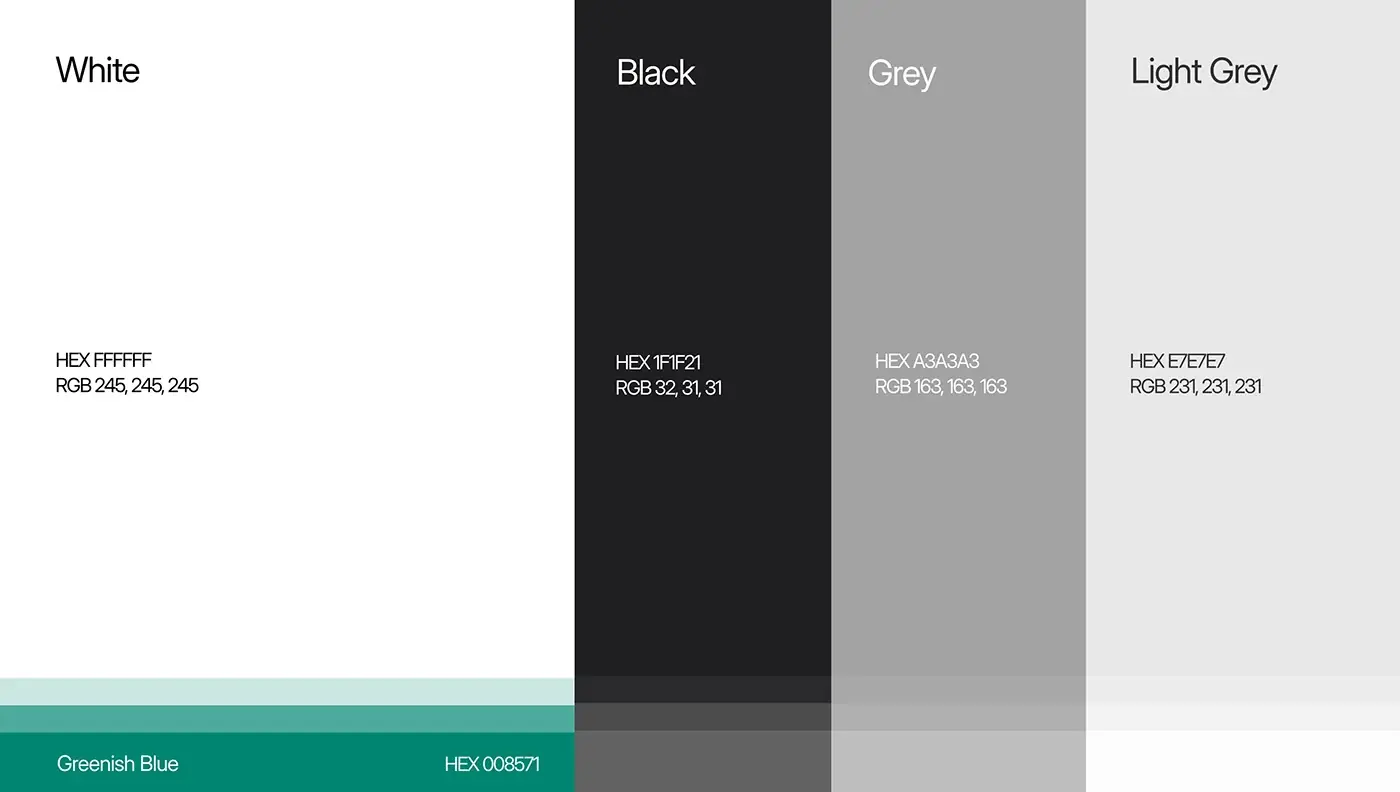
- Visual design: Inter Display in regular and medium, greys and one green accent.
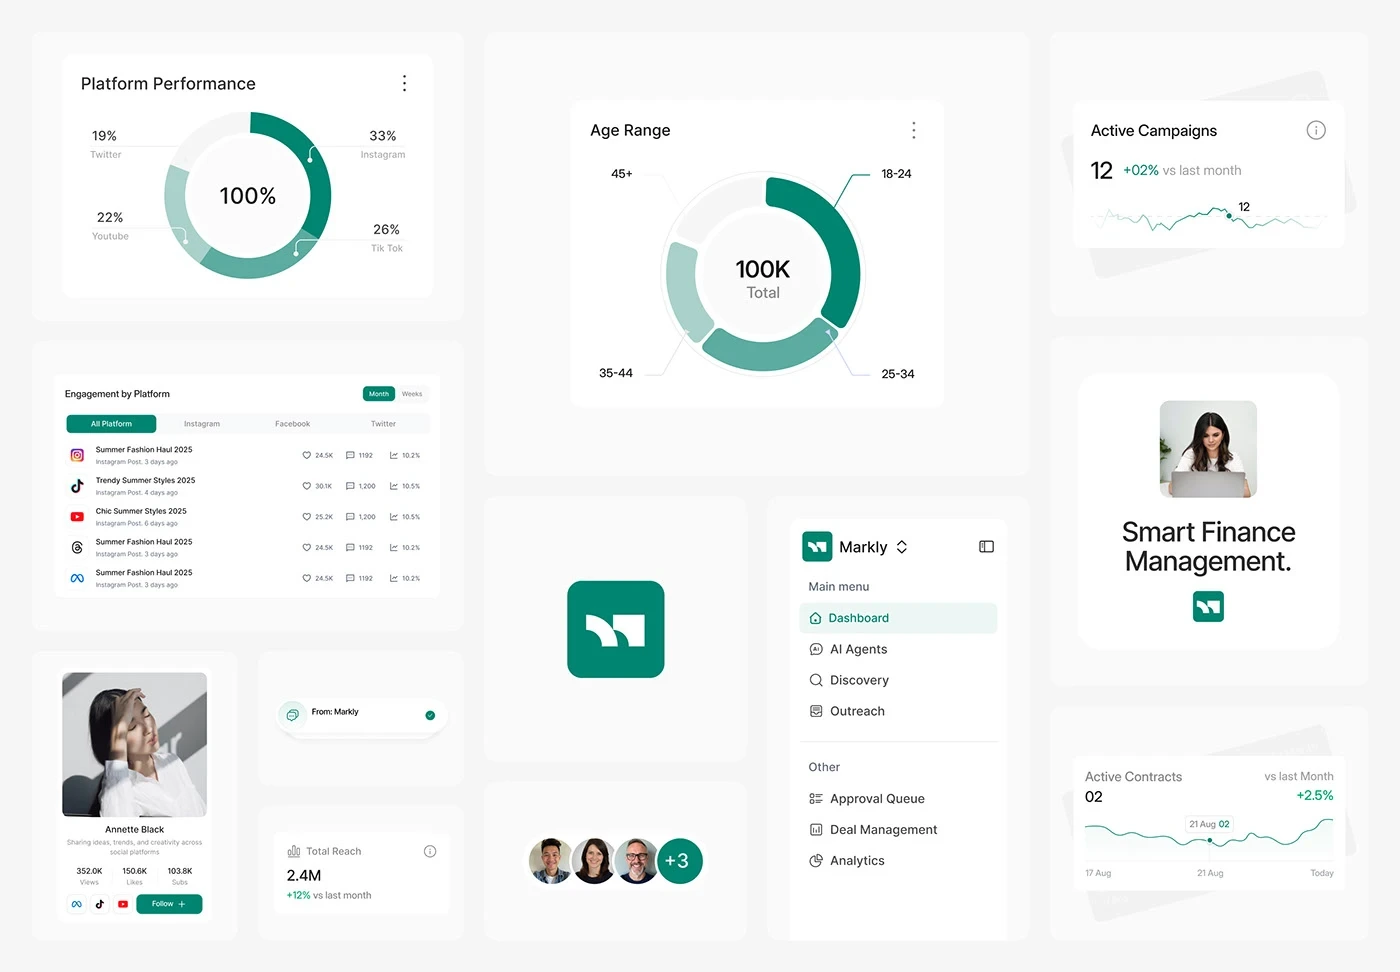
- Components: KPI cards, charts, creator cards and the sidebar, then prototyping and a design system.
The solution
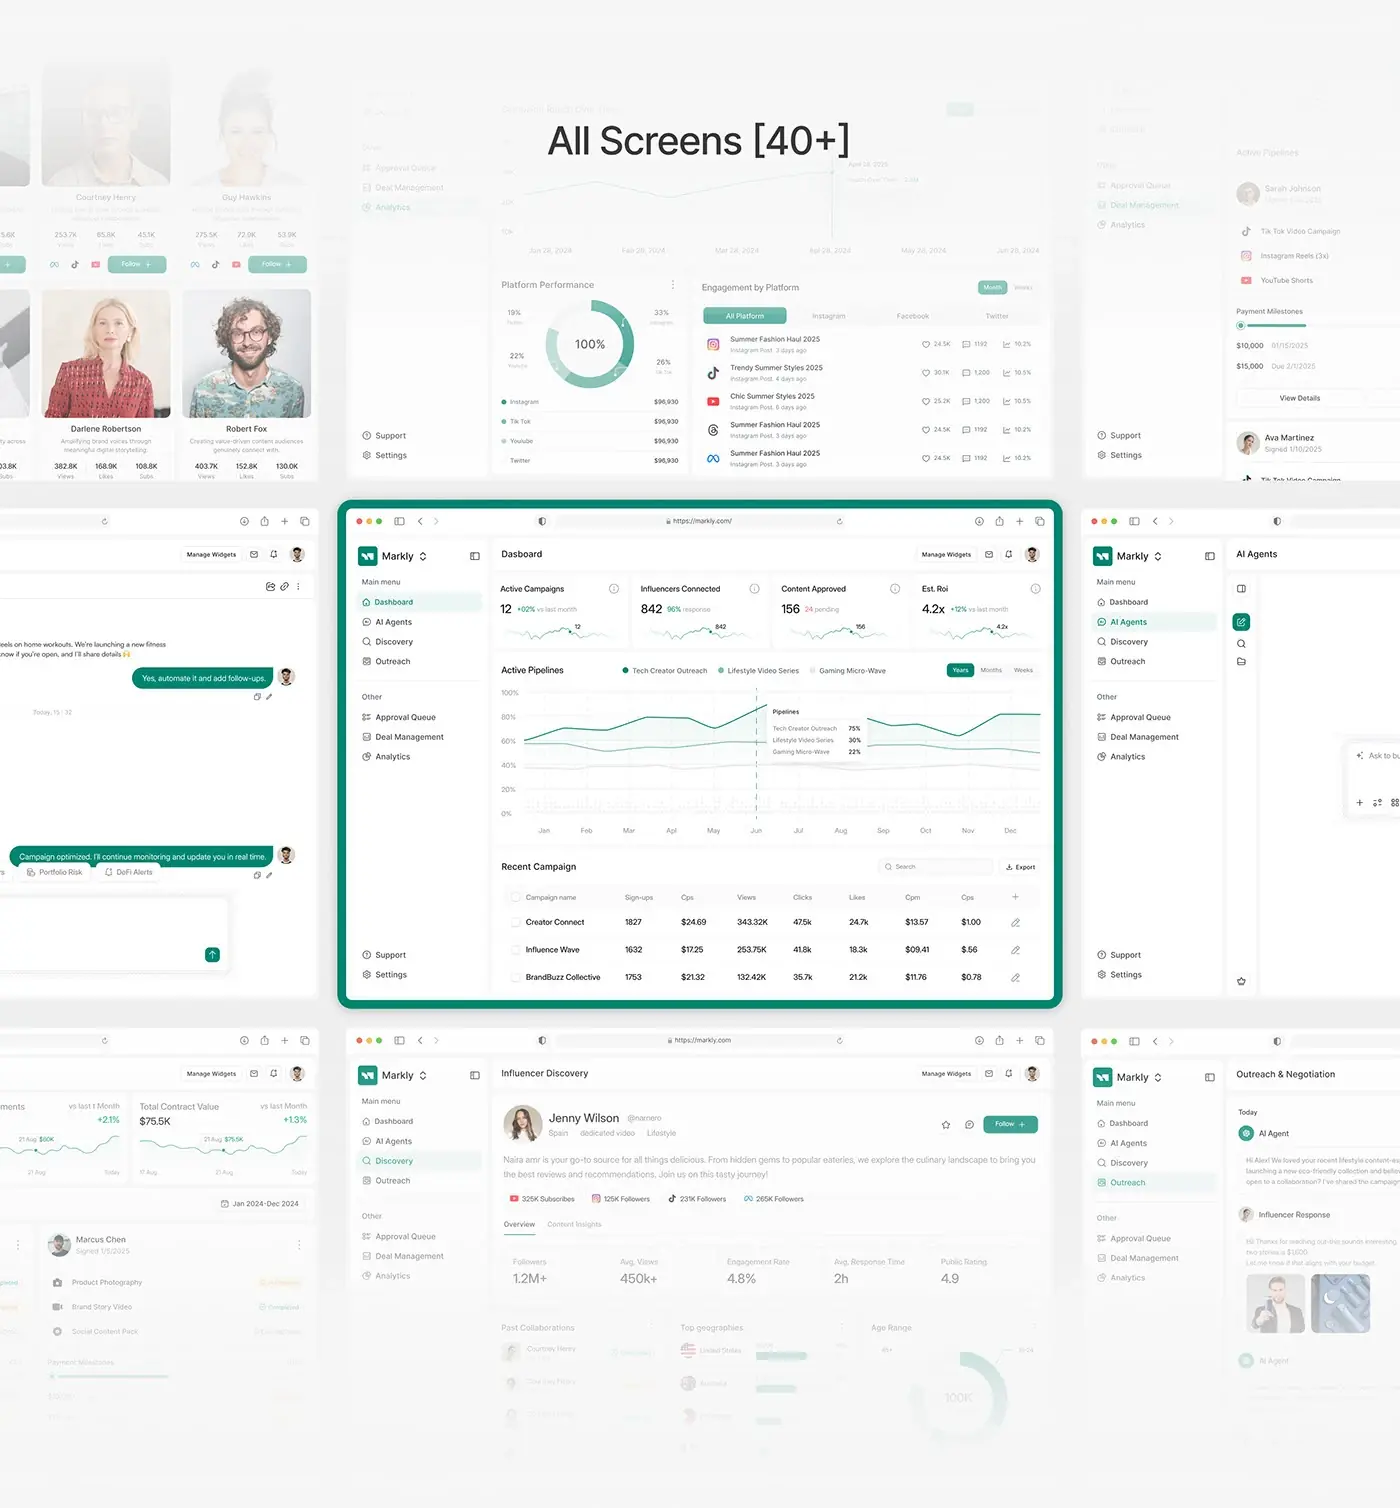
The dashboard puts the whole campaign in one place and keeps a person in charge of every deal. The sidebar separates daily work (dashboard, AI agents, discovery, outreach) from decisions and records (approval queue, deal management, analytics).
Campaign dashboard
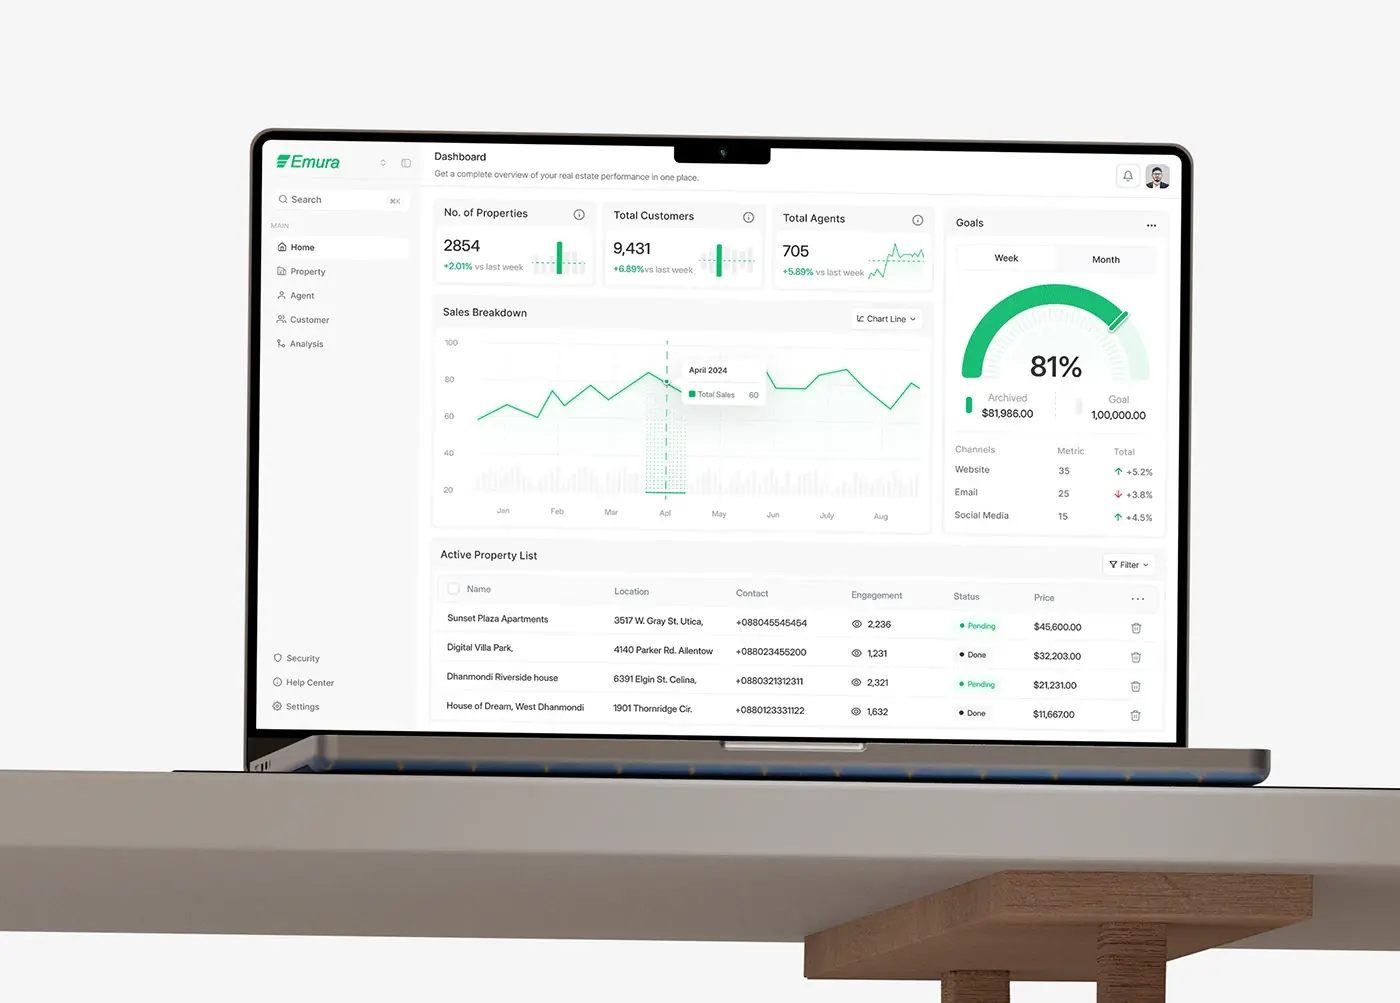
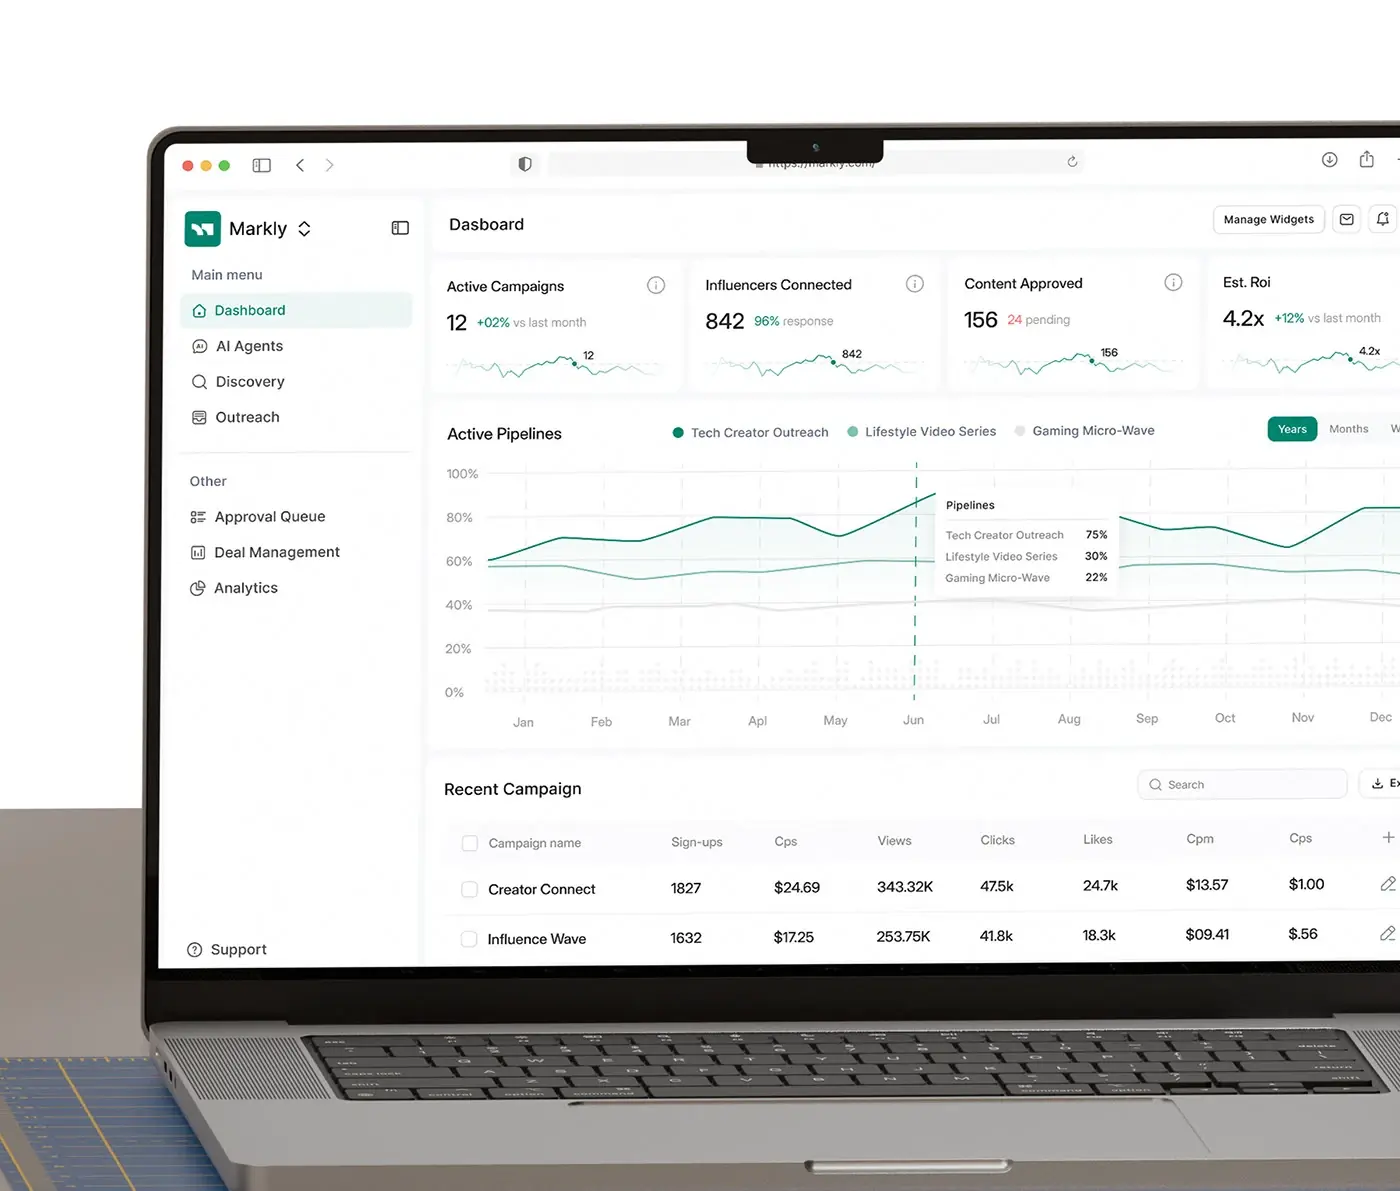
Four KPI cards with sparklines lead: active campaigns, influencers connected with their response rate, content approved with the number pending, and estimated return. An active pipelines chart compares campaigns by year, month or week, and a recent campaign table lists sign-ups, views, clicks, likes and CPM, with search and export. Manage Widgets lets a brand choose what it sees first.
Influencer discovery
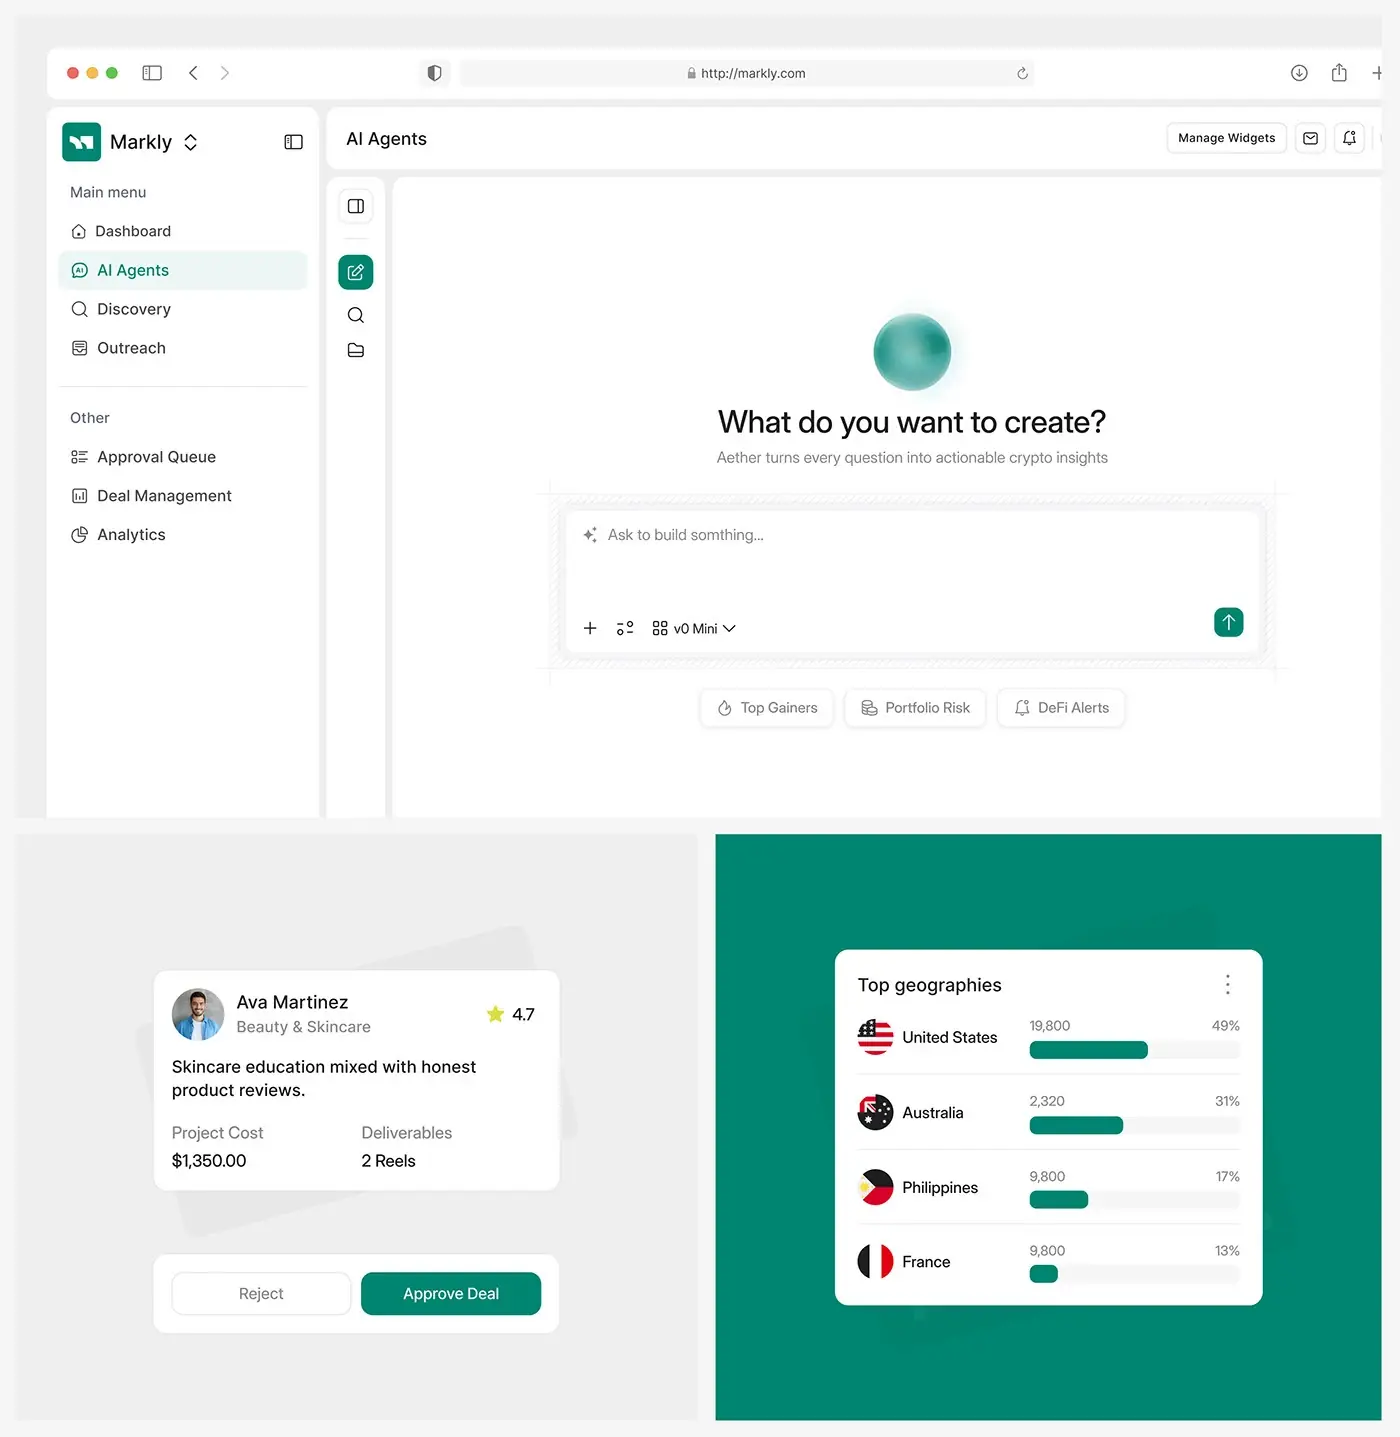
Creators appear as cards with a photo, a one-line bio, views, likes, subscribers, platform icons and a Follow button. A profile adds the handle, country and niche, followers per platform, average views, engagement rate, average response time and a public rating, then past collaborations, top geographies and age range. A brand can judge fit before any message goes out.
AI agents
The AI Agents page is a single prompt box: the brand describes what it wants and an agent takes it from there. In the chat, the brand answers "Yes, automate it and add follow-ups", and the thread then confirms the campaign is optimised and will be monitored in real time. Every agent step reads as a message, so the brand can scroll back and see what was done.
Outreach and negotiation
Outreach is one thread per creator. The agent's opening message, the influencer's reply with a rate and sample images, and the agent's follow-up all sit in order under Today. Nobody pieces a negotiation together from separate inboxes, and the brand sees exactly what the agent said in its name.
Approval queue
Each deal an agent proposes arrives as a creator card: name, niche, rating, a one-line pitch, project cost and deliverables, such as two short videos. Two buttons sit under it: Reject and Approve Deal, with approval as the filled green button. Nothing is agreed until a person presses one of them, which is what makes the automation safe to hand over.
Deal management
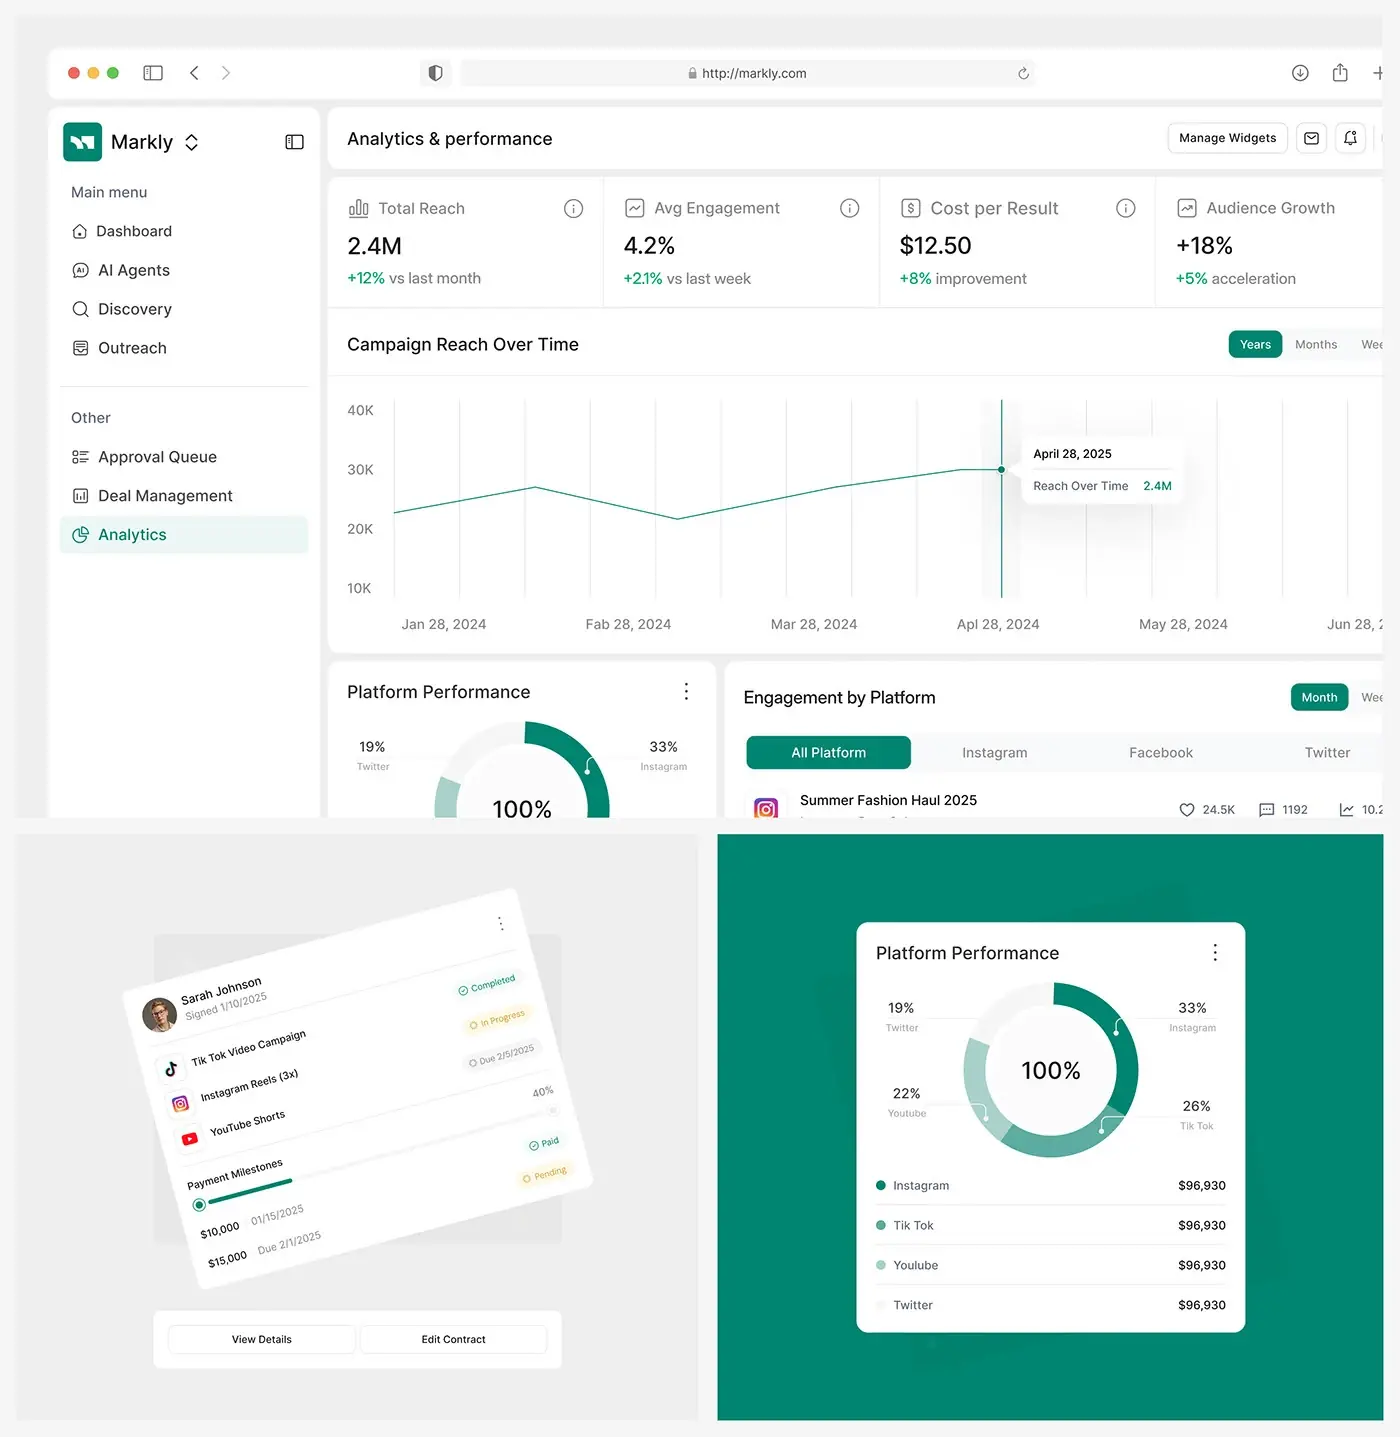
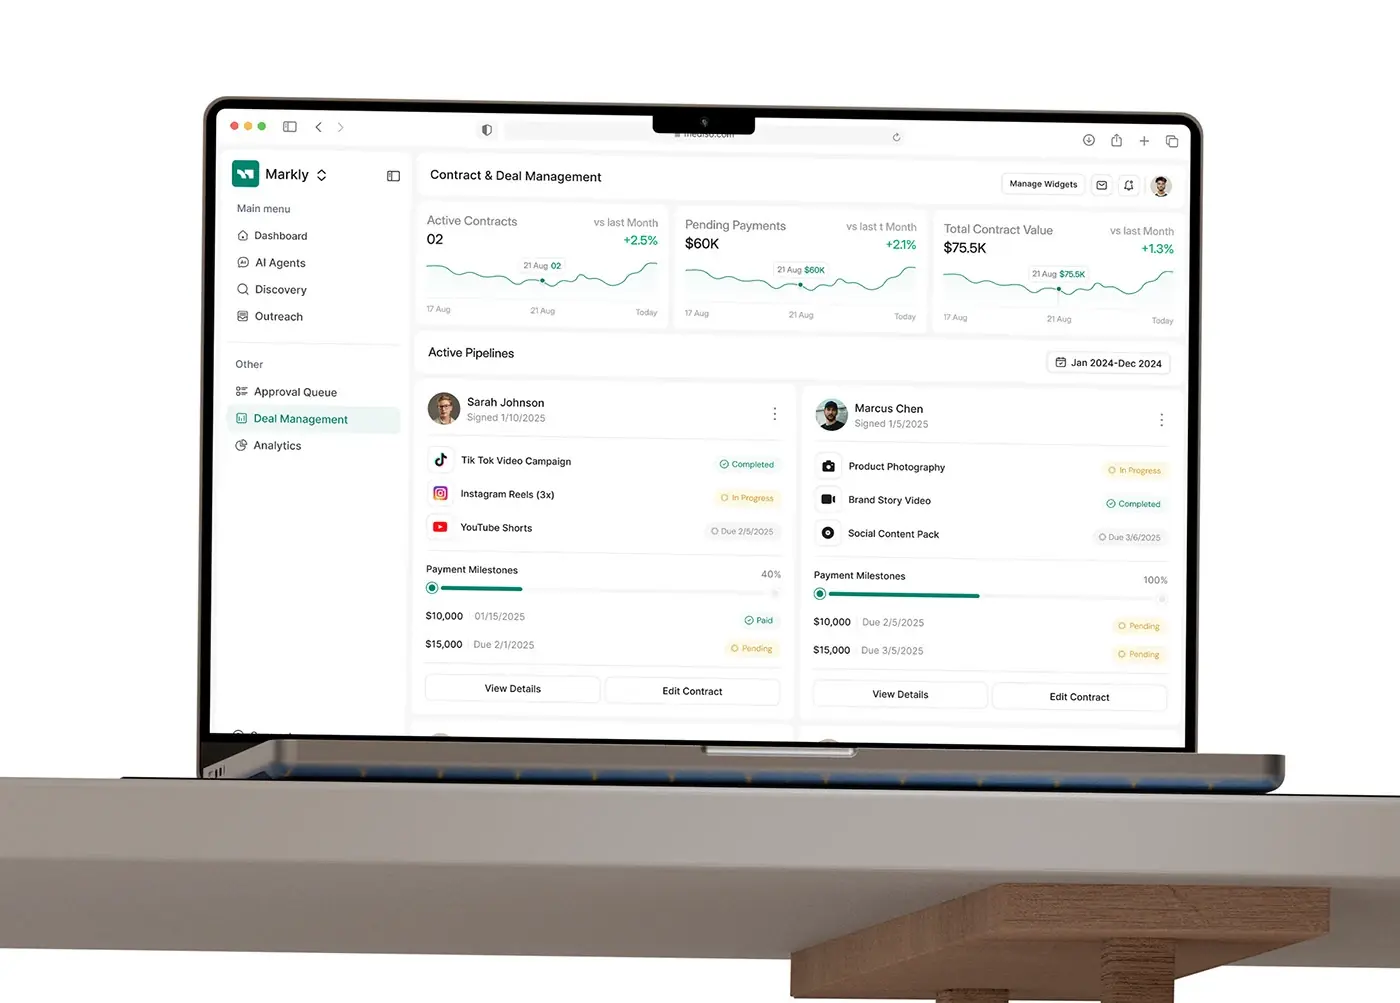
Active contracts, pending payments and total contract value lead, each against last month. Every signed creator gets a card listing deliverables, from a short video campaign to a social content pack, each marked completed, in progress or due. Payment milestones show a progress bar with each instalment marked paid or pending, with View Details and Edit Contract below.
Analytics
Total reach, average engagement, cost per result and audience growth sit above a campaign reach chart. Platform performance splits results across four social networks, and engagement by platform lists posts with likes, comments and engagement rate, filterable by network. Top geographies and an age range chart show who the campaigns actually reached.
Mobile view
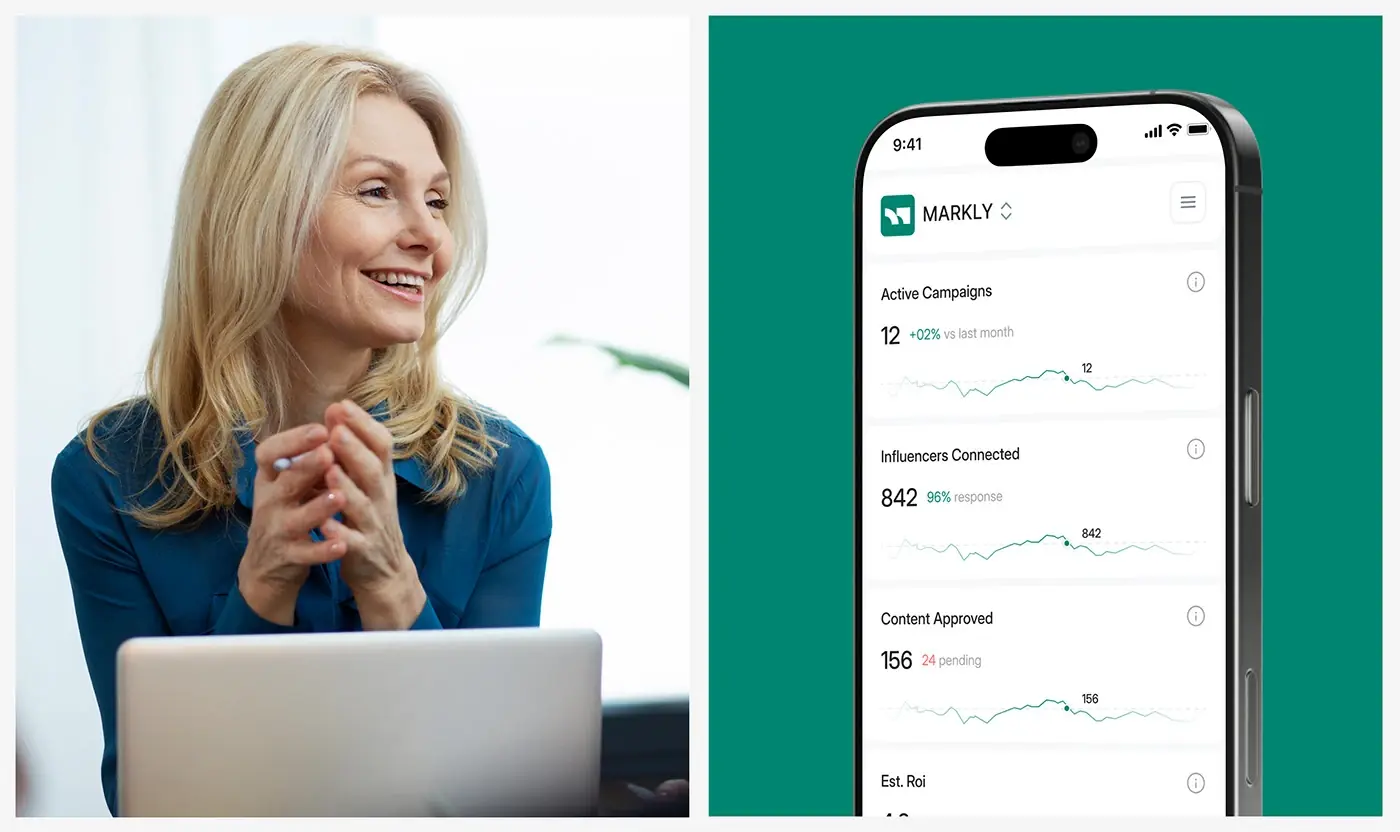
On a phone the KPI cards stack into one column: active campaigns, influencers connected, content approved and estimated return, each with its sparkline. The order matches the desktop, so a brand checking in between meetings reads the same story in the same sequence.
The result
- More than 40 web screens for the dashboard, discovery, outreach, AI agents, approval, deals and analytics.
- A mobile view of the dashboard.
- Type, colour and a reusable component set.
- The presentation.
How it helps the client
The design lets a brand run creator campaigns from one screen and hand the legwork to AI agents, while every deal still waits for a person's yes. Seeing what an agent did is what makes automation feel safe to use. More of this work is in my AI product case studies. That's my approach to product design for AI platforms.