
Overview
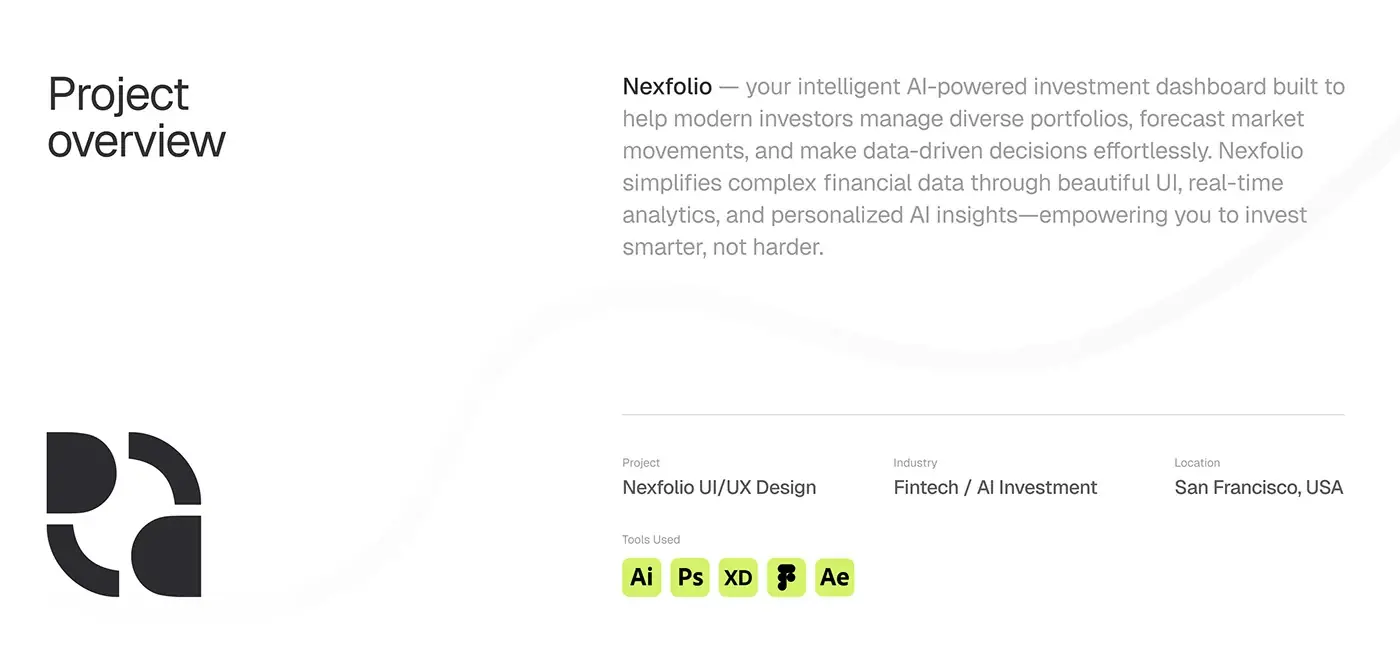
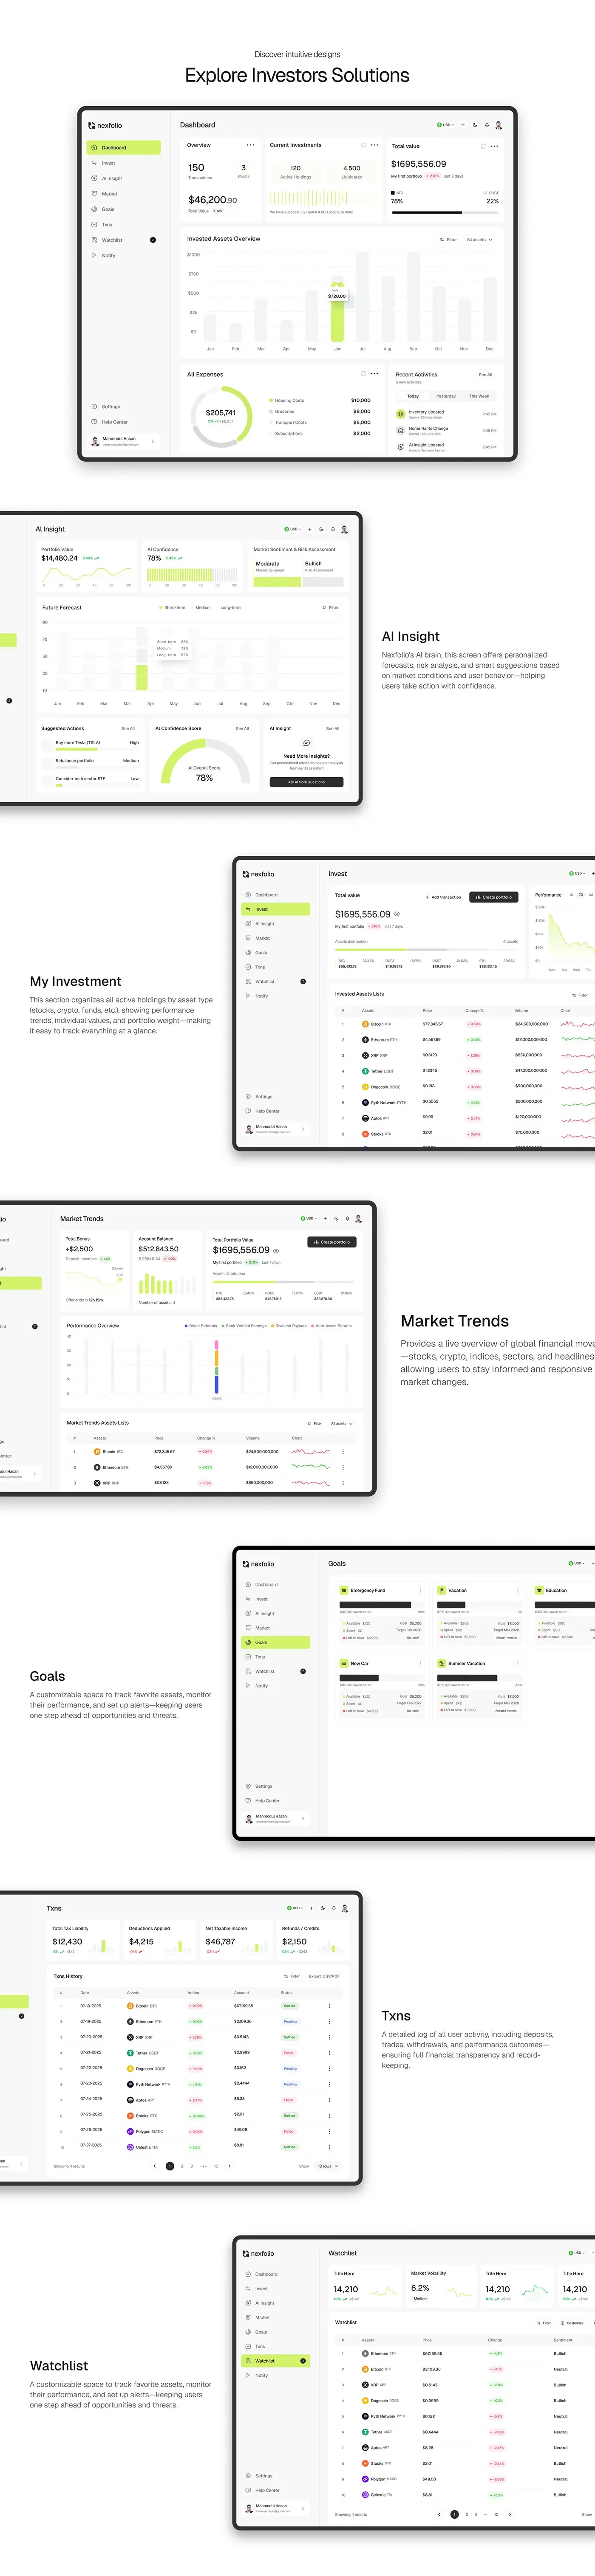
Nexfolio is an AI-powered investment dashboard for people managing diverse portfolios, and this case study walks through its investment dashboard design screen by screen. I designed the web app, from the main dashboard to goals and the watchlist, plus the grid, spacing and type system behind it.
The challenge
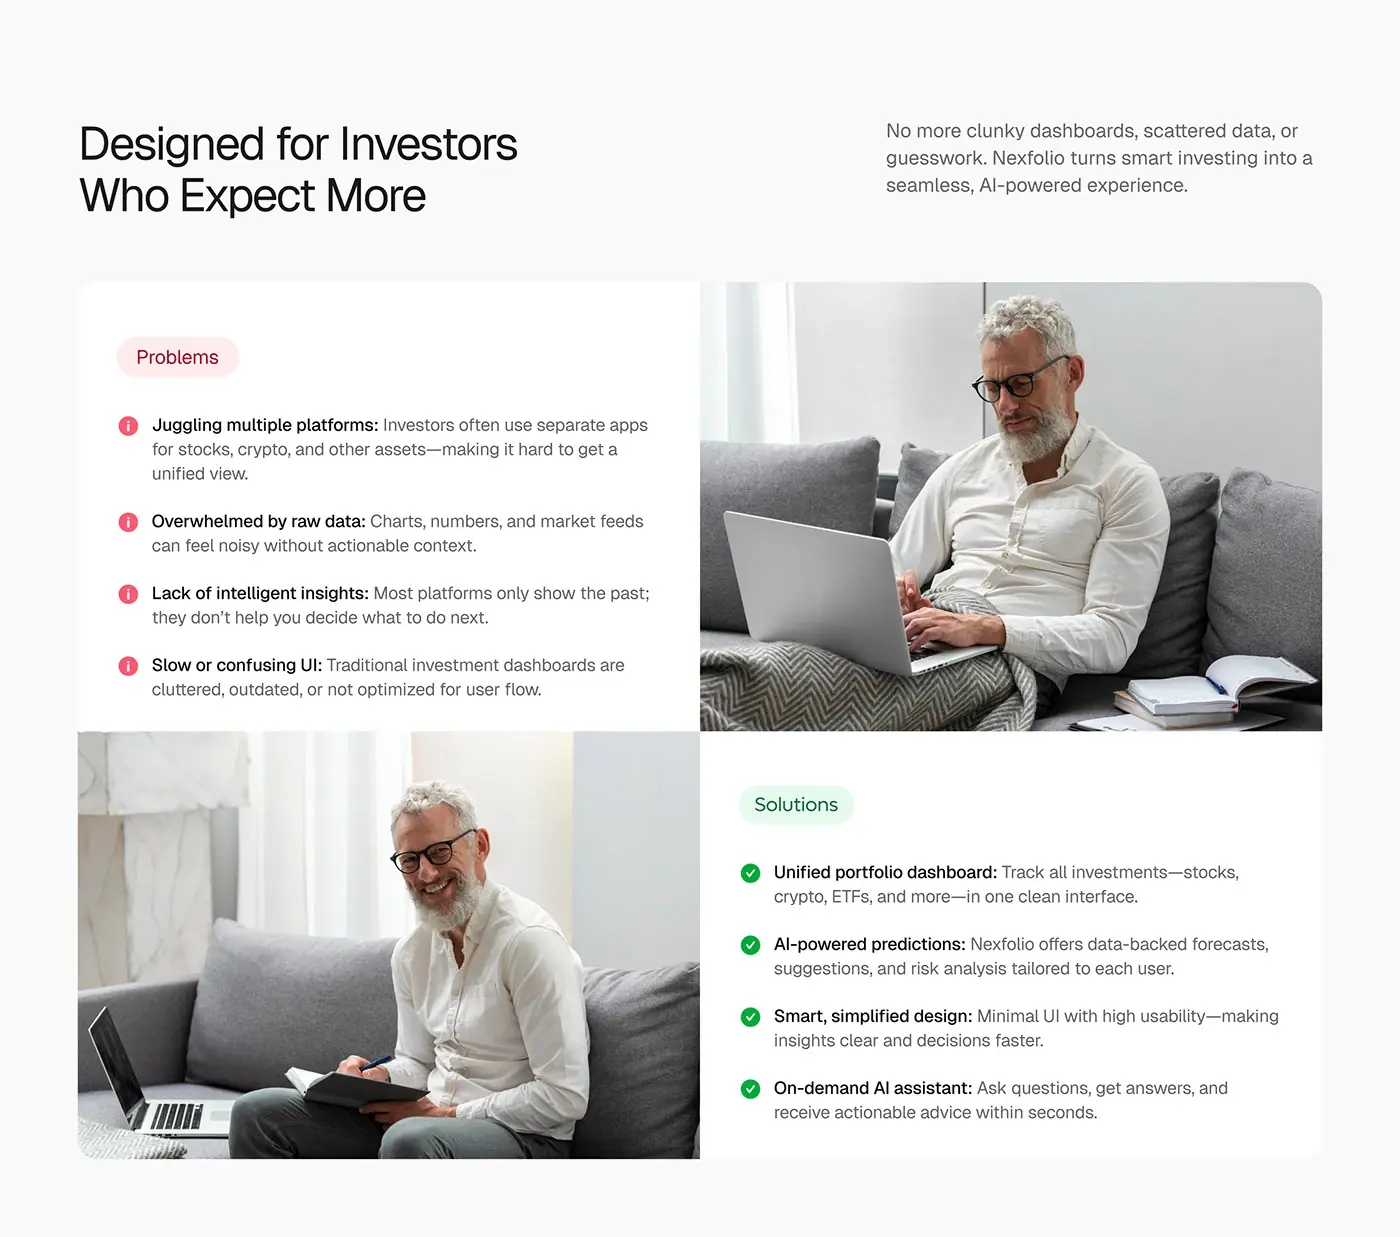
The deck lists four problems investors run into.
- Separate apps for stocks, crypto and other assets, with no unified view.
- Charts and market feeds that feel noisy without context.
- Platforms that only show the past, not what to do next.
- Cluttered, dated dashboards that are hard to move through.
The answers it sets out: one portfolio dashboard for stocks, crypto and ETFs, AI forecasts and risk analysis for each user, a minimal interface, and an AI assistant that answers questions on demand.
The process
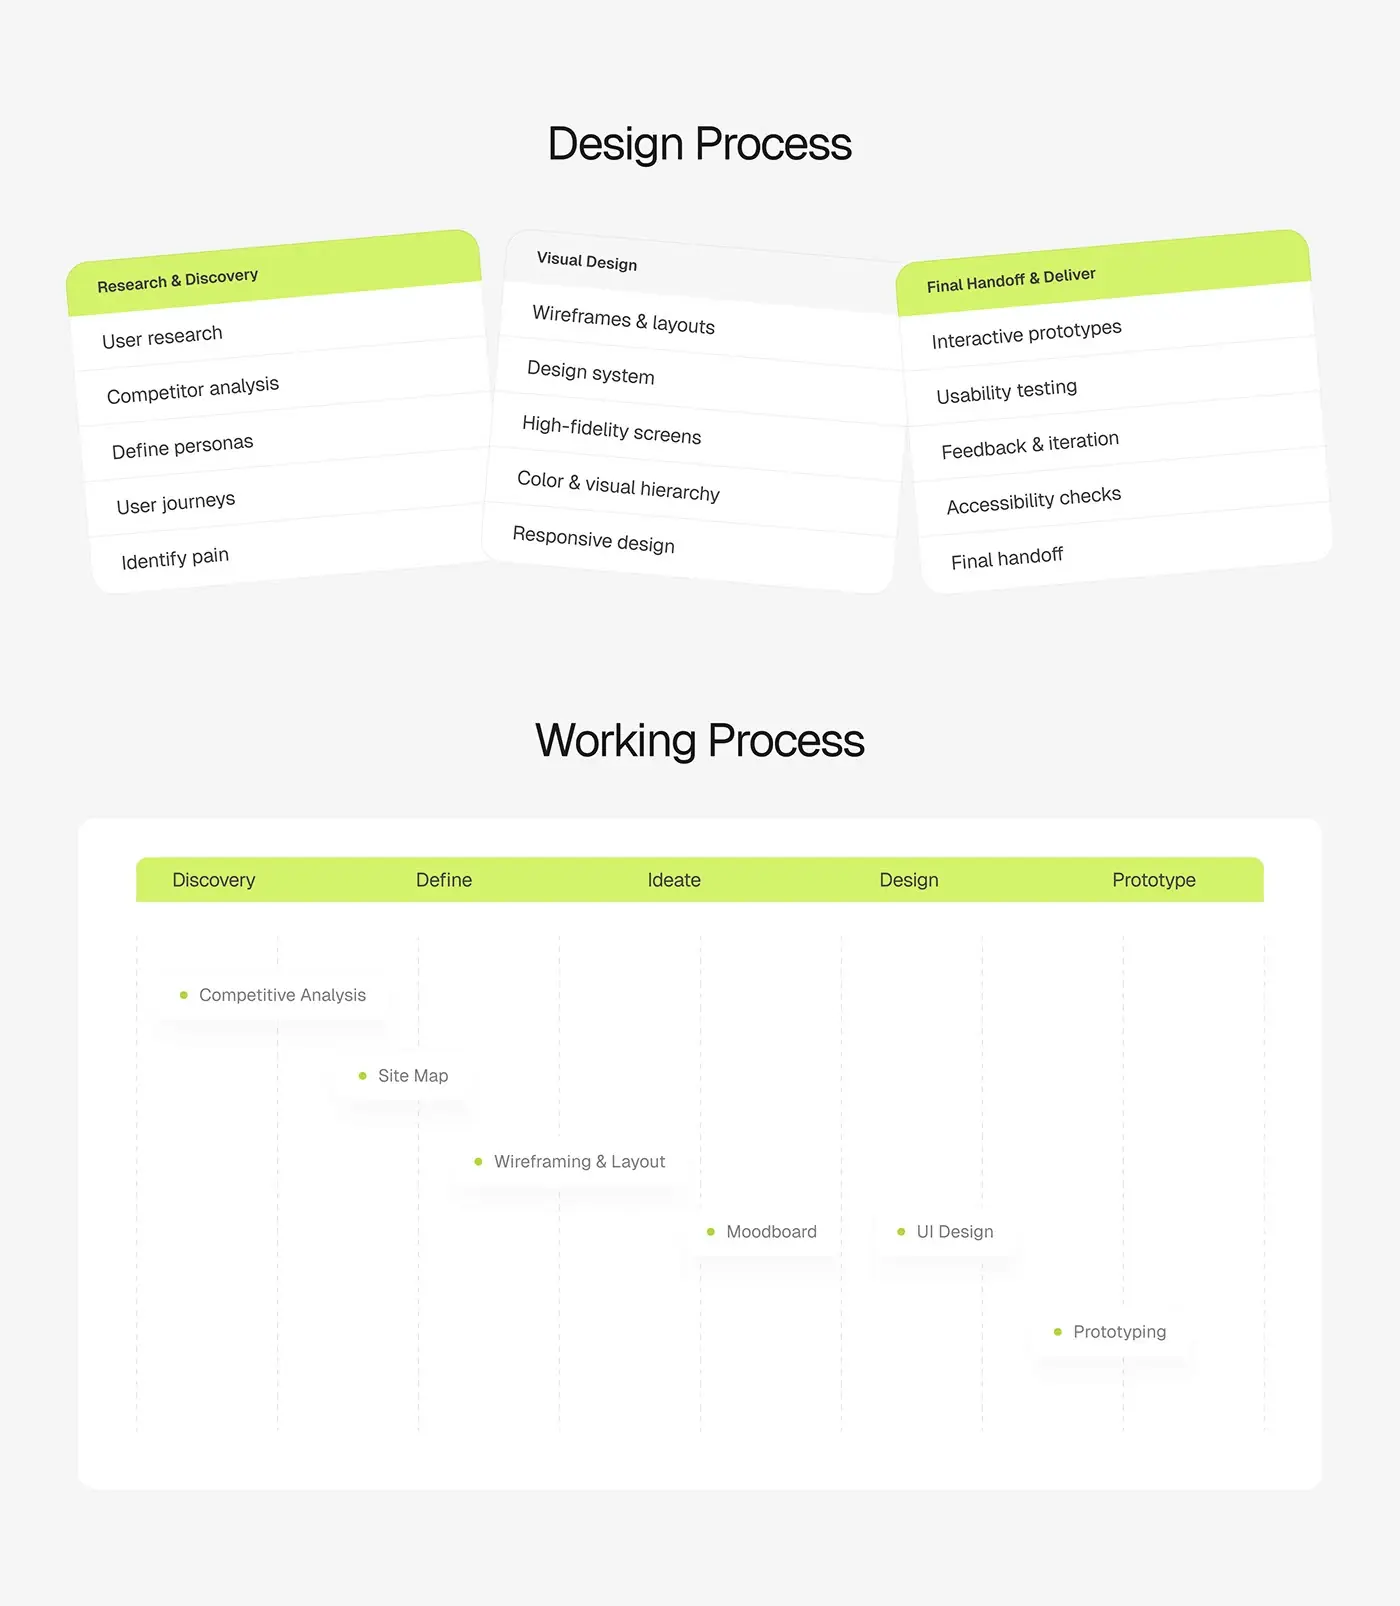
- Research: user research, competitor analysis, personas, user journeys and pain points.
- A site map, then wireframes and layouts.
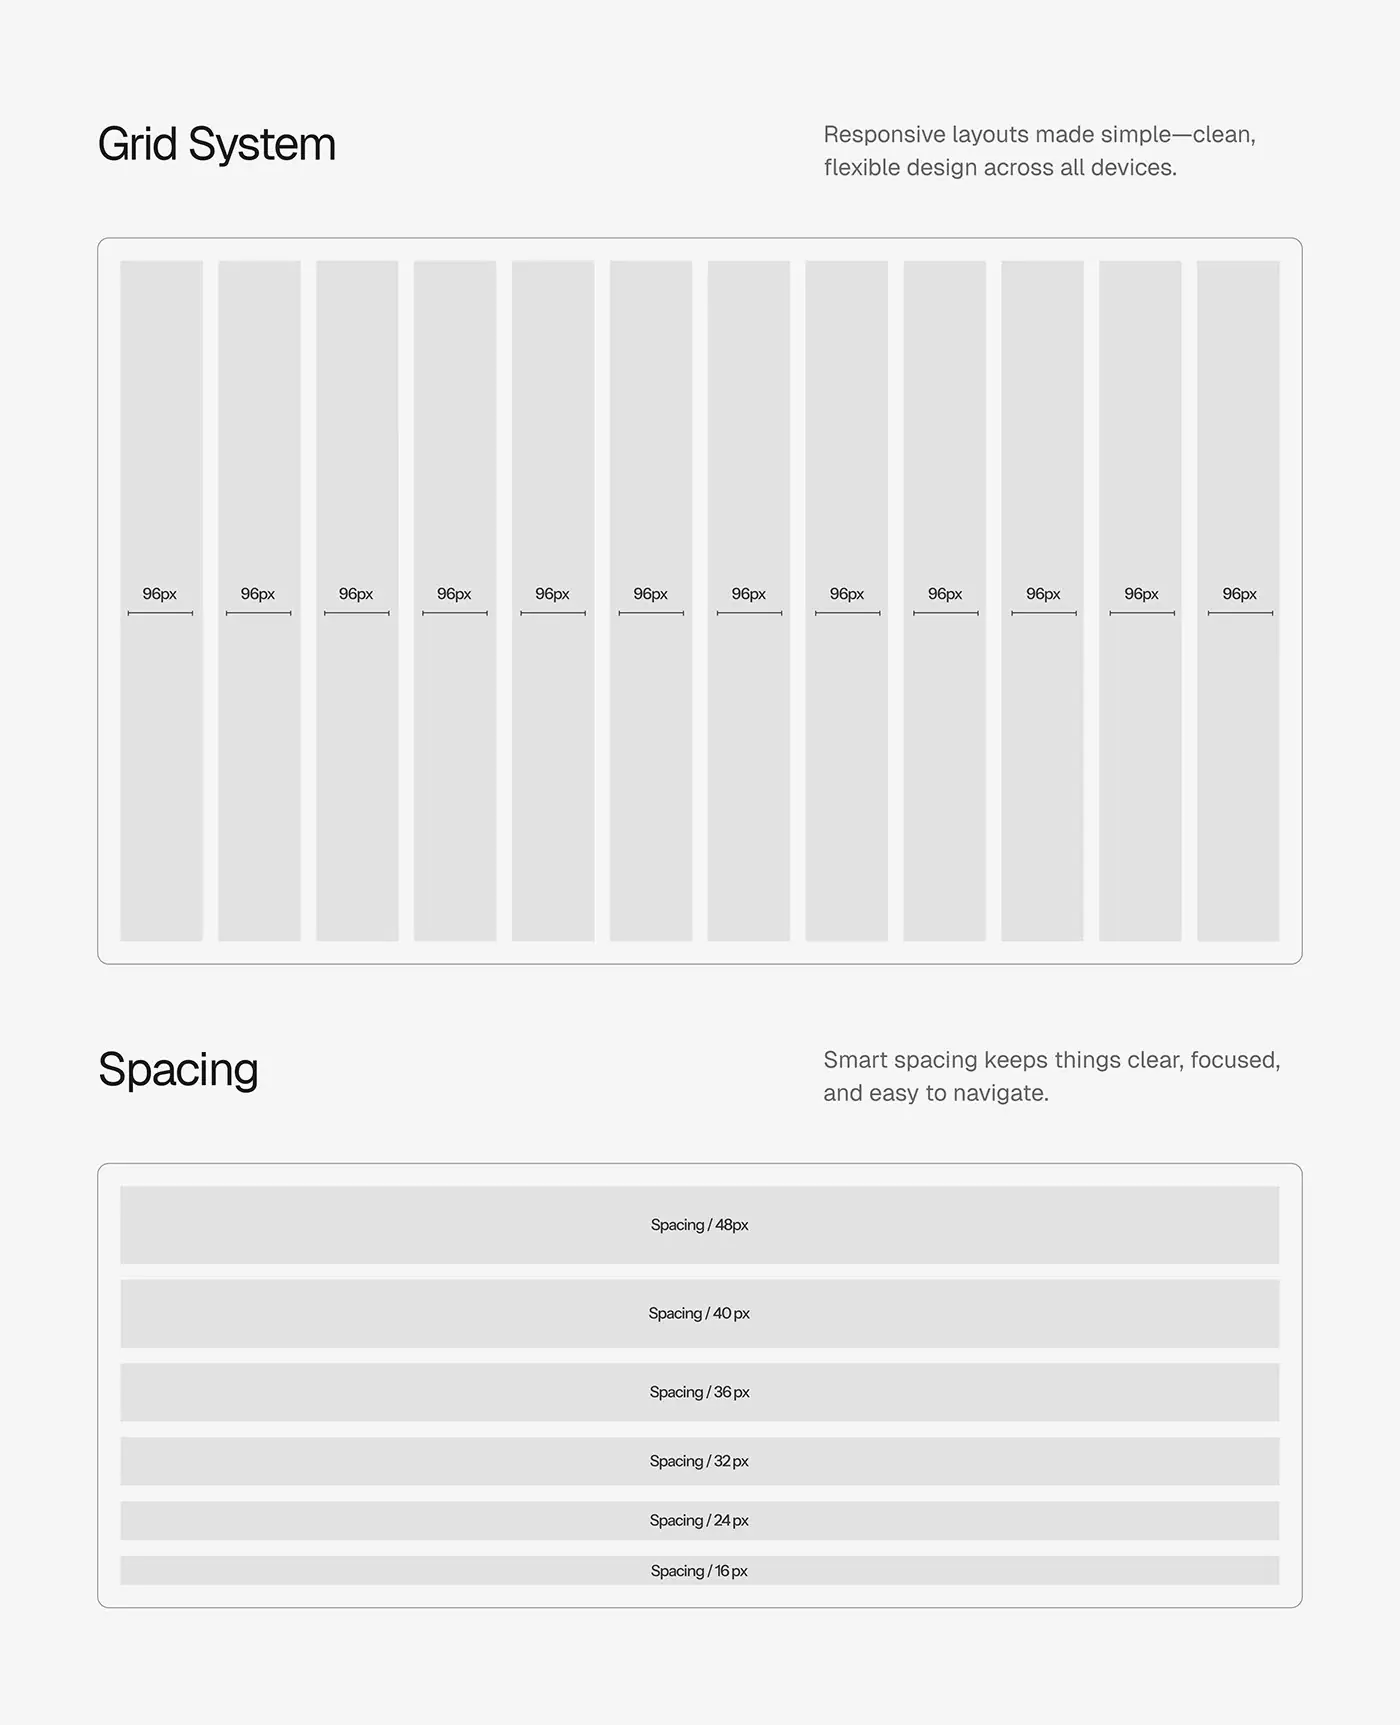
- A moodboard and UI design on a 12 column grid with a fixed spacing scale.
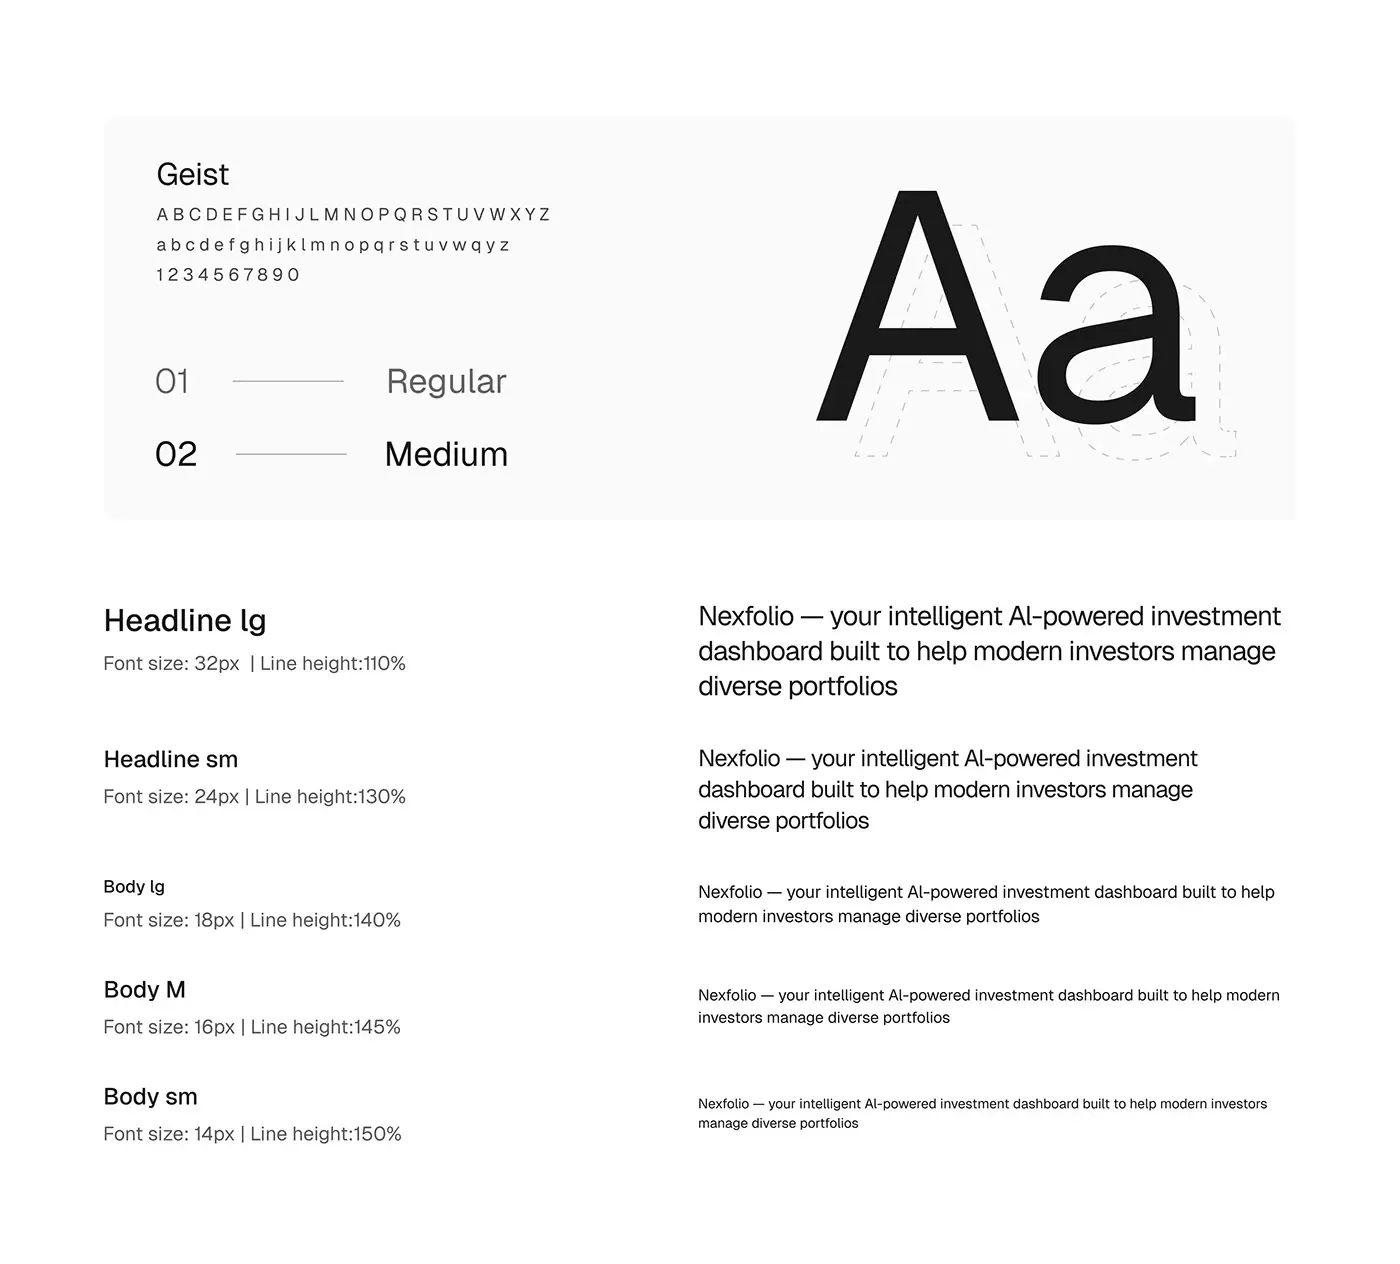
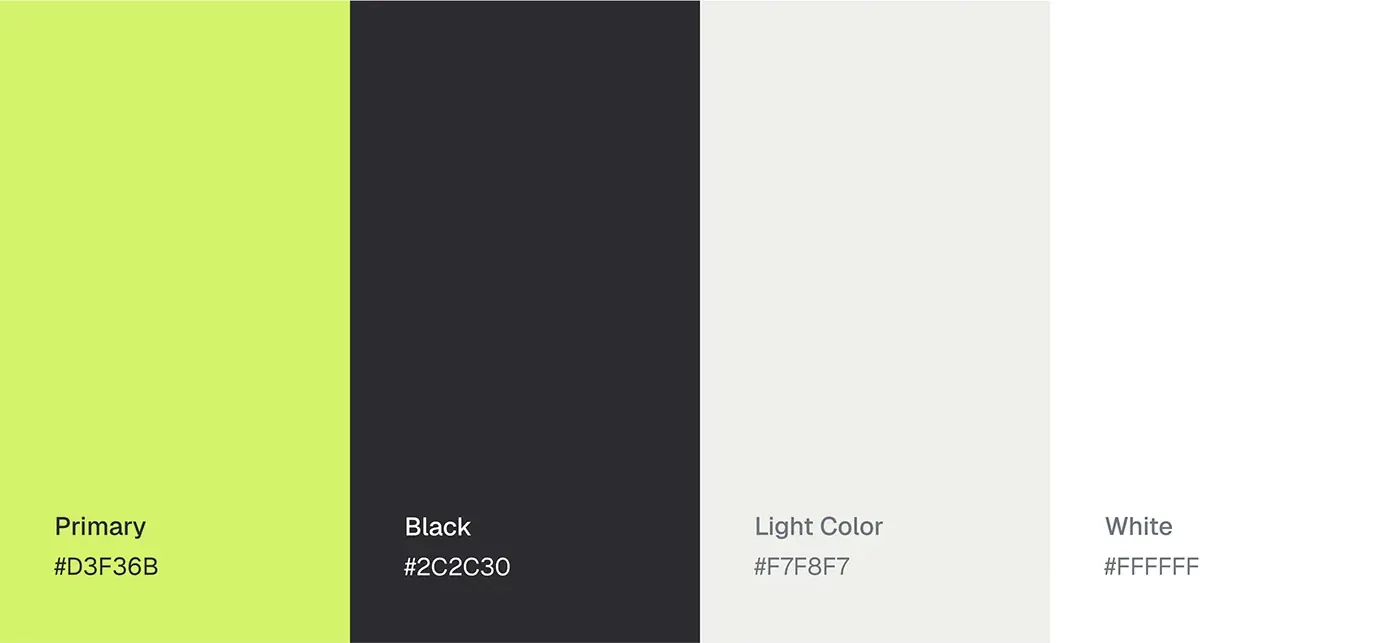
- A design system: Geist, a type scale from 14 to 32px, lime on graphite and white, with colour and visual hierarchy set for responsive layouts.
- Interactive prototypes, usability testing, feedback and iteration, accessibility checks and handoff.
The solution
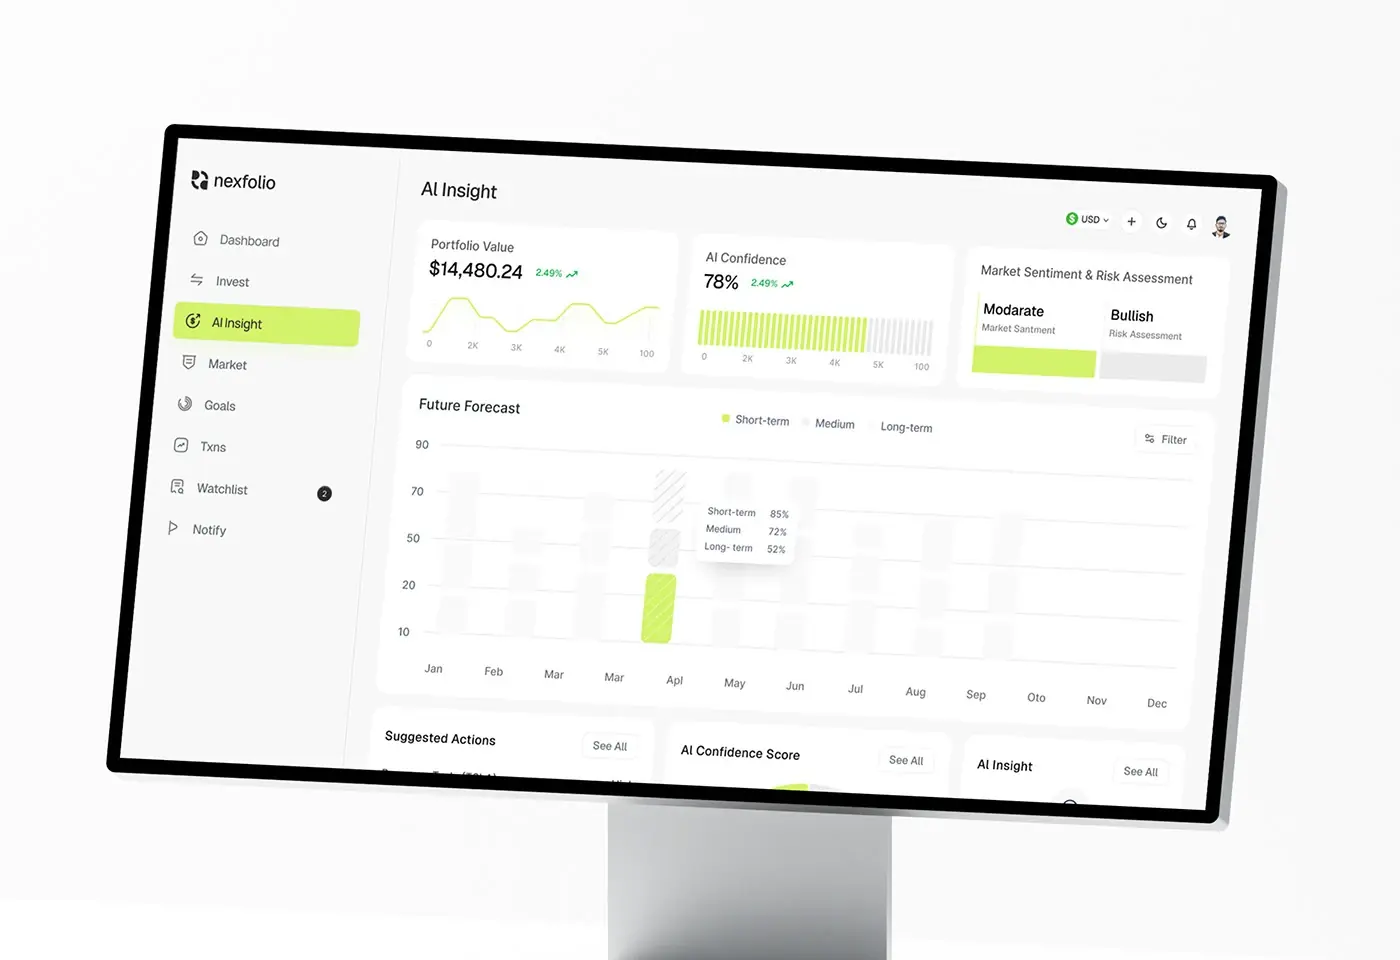
Every screen shares one sidebar and one grid, so numbers line up from page to page. The sidebar holds Dashboard, Invest, AI Insight, Market, Goals, Txns, Watchlist and Notify, with a currency switch and dark mode toggle in the top bar.
Main dashboard
Three cards lead: an overview of transactions, wallets and total value, current investments with active holdings and liquidated assets, and total value split by coin. An invested assets chart by month fills the middle, with a filter. Below sit all expenses as a ring (housing, groceries, transport and subscriptions) and recent activity for today, yesterday and this week, so stocks, crypto and spending stop living in different apps.
AI Insight
Portfolio value, AI confidence and market sentiment with a risk assessment share the top row, so the AI's read sits next to the number it explains. A future forecast chart compares short, medium and long term outlooks by month. Below, suggested actions carry a High, Medium or Low priority, an overall confidence score shows as a gauge, and an Ask AI More Questions button opens the AI assistant.
My Investment
The Invest page shows total value with Add transaction and Create portfolio buttons, then assets distribution as one bar split by asset, with each value and share underneath. A performance chart switches between one day, seven days and one month, and the invested assets list gives price, change, volume and a small chart for every holding, to show where the money sits.
Market Trends
Cards for total bonus, account balance and total portfolio value lead the page. A performance overview chart separates direct referrals, bank verified earnings, dividend payouts and auto-invest returns. The market trends list ranks assets by price, change, volume and a sparkline, with a filter and an asset type menu, so investors can react to the market without leaving the app.
Goals
Each savings goal is a card, such as an emergency fund, education or a new car: a progress bar with its percentage, the amount saved so far, money available, spent and left to save, the goal amount, a target date and a status such as On track or Ahead 2 months. Investors see the future they're saving for, not only the past.
Transactions and watchlist
Txns opens on total tax liability, deductions applied, net taxable income and refunds, then a paged history with date, asset, action, amount and a Settled, Pending or Failed tag, plus CSV or PDF export. The watchlist lists assets with price, change and a Bullish or Neutral sentiment under summary cards such as market volatility, with filter and customise controls.
The result
- The web app: dashboard, AI insight, investments, market, goals, transactions and watchlist.
- A UI system: grid, spacing scale, Geist type scale and a four colour palette.
- Interactive prototypes and a final handoff.
How it helps the client
Nexfolio can give investors every asset and a suggested next step in one place, instead of a stack of apps and raw charts. The strict grid and quiet palette let the lime accent mark what matters. Planning a similar tool? Here's how I run product design for fintech dashboards, and you can browse more fintech case studies.