

A fleet management dashboard is the screen where a fleet manager sees every vehicle, driver and delivery at once and acts on what's going wrong. A good one has seven core views: a live map, vehicle status, alerts, maintenance, drivers, fuel or charge, and reports. It leads with four or five numbers, puts the exceptions just below, and lets someone fix a late vehicle without leaving the screen. If you're commissioning one, the hard part isn't the charts. It's deciding which events count as exceptions, where the data comes from, and what a person can do about each one.
I'm a design engineer: I design products and build them in production code, with web apps in React and Next.js. I designed FleetPulse, a fleet management dashboard for real-time control over vehicle networks, and walk through it below. The service behind this post is my product design work.
Who a fleet dashboard is for
- Dispatchers watch the live map and alert feed all day and act in seconds.
- Fleet managers check the top numbers each morning, then go into maintenance, drivers and costs.
- Owners and finance read reports: cost per mile, utilisation and on-time rate over months.
A logistics SaaS founder selling to many fleets adds a fourth person, the customer's admin, who sets up vehicles, users and rules. That setup flow is often missing from the first brief.
The core views of a fleet management dashboard
Overview. Four or five KPI cards, each with its change against last week, then the alert feed and a small live map. It should load fast.
Live map. The map gets most of the screen, with a narrow, searchable vehicle list where the eye starts. Show clear markers for moving, stopped and late, and how old each position is, so nobody trusts a stale dot.
Vehicle status. One row per vehicle: driver, current job, last position, status and any open issue.
Alerts. Maintenance due, route deviations, late vehicles, low fuel or charge. Each shows the vehicle, a one-line reason, how long ago and a button for the next step. Alerts that can't be acted on train people to ignore the feed.
Maintenance. Service schedules, open defects and vehicles off the road. In the US, under 49 CFR 396.11, motor carriers must have drivers prepare a written report at the end of each day's work on each vehicle, covering parts such as brakes, steering, lighting, tyres, mirrors, wheels and emergency equipment, and keep those reports for three months (with exceptions, such as a carrier running only one commercial vehicle). A defect logged on a driver's phone should land here as a repair task.
Drivers. Profiles, assignments, hours and performance. US rules required motor carriers to have drivers record duty status with an electronic logging device by 18 December 2017, with some exceptions, under 49 CFR 395.8. The dashboard usually reads that data from the device provider and shows it beside the schedule.
Fuel and EV charge. Fuel per vehicle and per mile, fuel card transactions, idling, and for electric vehicles, state of charge and charging sessions. Mixed fleets need one view that compares both on cost per mile.
Reports. On-time rate over time, cost by fuel, maintenance, labour and other, utilisation and driver comparisons, with exports for finance.
Must-have features, and why each one is there
| Feature | Why it's a must |
|---|---|
| KPI cards with change against a past period | A number without a comparison can't tell you whether to act |
| Alert feed with an action on each item | Turns watching into fixing |
| Live map with position age | A stale position misleads if nobody knows it's stale |
| Search and filters on every list | Find a vehicle by plate, driver or job in seconds |
| Maintenance schedule and defect queue | Vehicles off the road cost money every day |
| Role-based access | Drivers, dispatchers and finance need different controls |
| Exports and an audit trail | Numbers leave the dashboard, and someone will ask who changed a route |
Common mistakes in fleet dashboard projects
Every number at the same weight. Twenty metrics at the top means nothing stands out. Pick the few a manager checks every morning.
Colour everywhere. If every card has a tinted icon, an alert has nothing left to stand out with.
Alerts with no next step. "Vehicle late" alone sends the dispatcher to a phone. Put Contact, Reassign or Reroute beside it.
Designing before the data is mapped. Telematics units, logging devices, fuel cards and your order system each report at their own rate. I list every source and how fresh its data is before I draw a screen, because that decides what can honestly be called live.
Desktop only. Managers walk the yard with a tablet. Design the main views for both from the start.
How I'd approach your fleet management software, from intro call to launch
- A free 30 minute intro call. I ask how many vehicles you run, which devices and systems you use, who opens the dashboard and what goes wrong most.
- A written scope and one fixed quote for the whole project. No retainer, nothing billed by the hour.
- The data and exception map. Every source, how often it updates, and each event that counts as an exception, with its action.
- Weekly design sprints in Figma, with a written update in Slack every 48 hours and a review call each week.
- A documented design system, with tokens and components named the same in Figma and in code.
- The build. The web app in React and Next.js, connected to your telematics and order data, plus a React Native or Flutter app if drivers need one. I use AI coding tools where they save time, and a person who knows the design reviews every change.
- Launch on real data, checking position age, alert rules and exports against your own fleet.
My development page covers the build, and my logistics industry page covers the sector.
Case study: how I designed FleetPulse
FleetPulse is a logistics dashboard for real-time control over vehicle networks, in logistics and transportation, New York, USA. Fleet teams use it to track vehicles, plan routes and monitor performance. I designed the web dashboard for desktop and tablet, plus a marketing landing page, in Figma, Illustrator and Photoshop.
The problem. Fleet teams worked across fragmented tools. Data arrived late, poor visibility slowed responses when something went wrong, and jumping between systems slowed decisions.
The system. Inter Display with a clear blue, light greys and near black, a 12 column grid with 96 px columns, line icons and reusable cards for alerts, insights, drivers and storage.
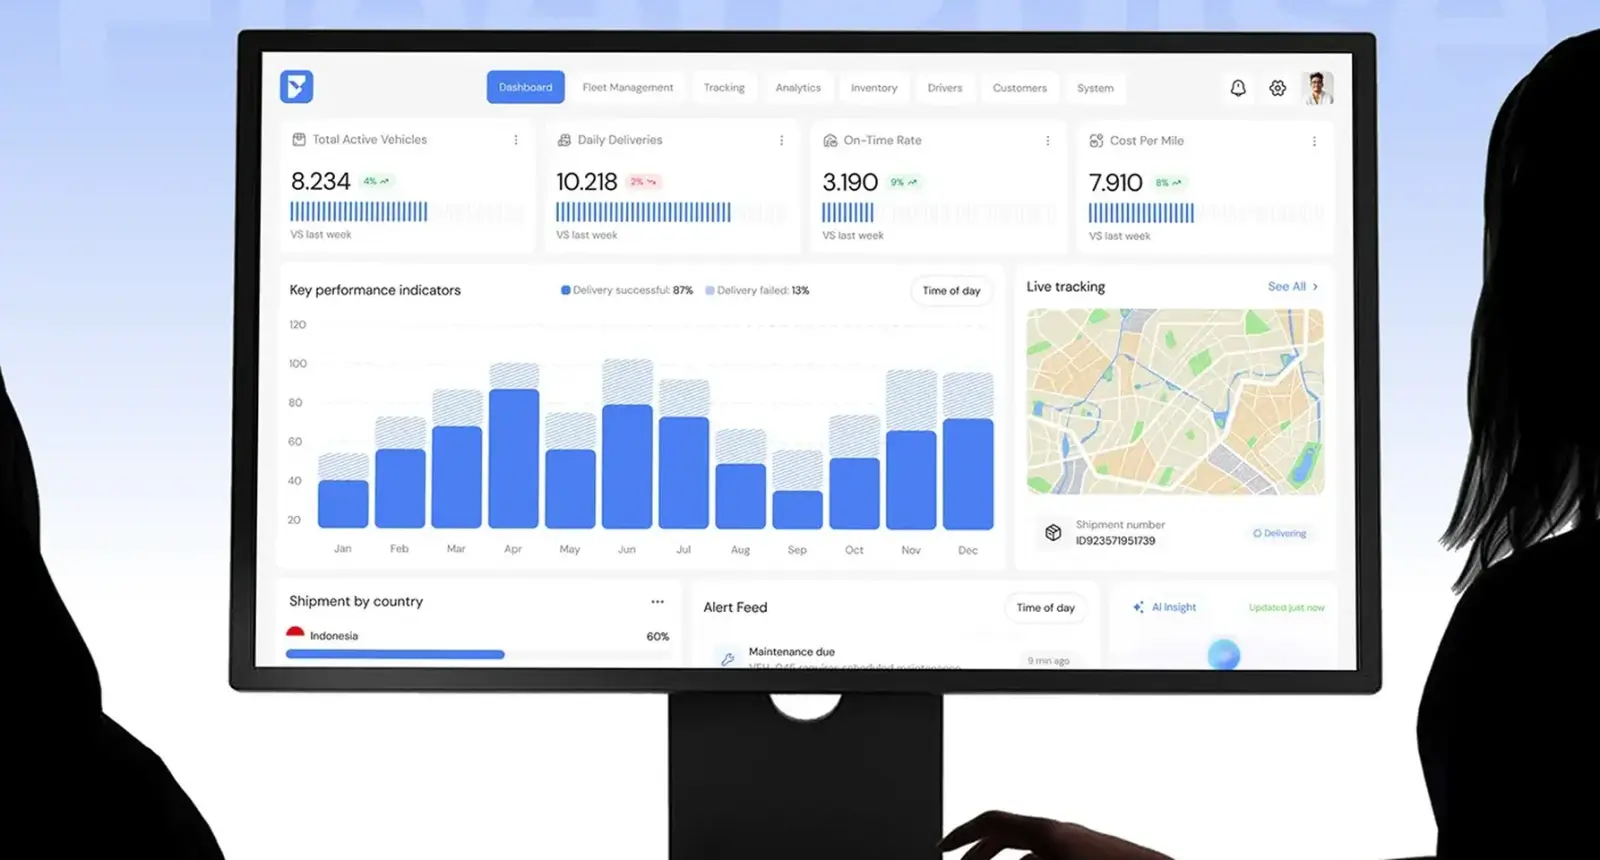
Main dashboard. Four KPI cards: total active vehicles, daily deliveries, on-time rate and cost per mile, each with its change against last week. Below, a monthly chart of successful and failed deliveries beside a live tracking map, then shipment by country, the alert feed and an AI insight card.
Alerts and AI insight. The alert feed lists maintenance due, route deviations and late vehicles, each with the vehicle code, a one-line reason and how long ago. The AI insight card predicts a weather delay on Route 7A and recommends a backup driver, with an Apply Recommendation button. Only alerts get tinted icons.
Fleet management and routes. One view follows a delivery: stop 11 of 18 on route 12, the address with an ETA, a proof of delivery photo slot and Contact or Mark Delivered. Beside it, route optimisation shows suggested changes with minutes saved and service level impact, ready to preview or apply.
Tracking, analytics and inventory. Analytics shows delivery success rate, cost split into fuel, maintenance, labour and other, a delivery density heatmap and a driver ranking. Inventory gives each warehouse a card with storage utilisation, orders, staff and temperature.
FleetPulse has no dedicated maintenance or EV screen; maintenance appears as alerts and as a cost line. The reusable cards let areas such as Drivers and Customers follow in the same style.
What decides the cost of fleet management software development
I don't publish prices; after the intro call you get one fixed quote for your scope. These move it:
- Data sources. Each telematics provider, logging device, fuel card and order system is an integration.
- Views and roles. A dispatcher screen alone is a different build from seven views with role-based access.
- One fleet or SaaS. A product for many fleets needs accounts, setup flows, per-customer permissions and billing.
- People. The US Bureau of Labor Statistics puts median pay for software developers at $135,980 a year, from May 2025 data, in its Occupational Outlook Handbook.
- Usage-priced services. On the Google Maps Platform price list, Dynamic Maps includes 10,000 free loads a month, then costs $7.00 per 1,000 up to 100,000. Multi-vehicle Route Optimization (FleetRouting) includes 1,000 free, then costs $30.00 per 1,000 at the first tier. A dashboard left open all day loads a lot of maps.
The software is judged against the cost of running the fleet. ATRI's 2026 update of its operational costs study put the average cost to operate a truck in 2025 at $2.336 per mile, up 3.4% on 2024, with repair and maintenance up 8.6%, as reported by Transport Topics. That's why cost per mile belongs in the KPI row. For layouts built around other jobs, see my dashboard design examples.
How to choose who builds your fleet dashboard
- Ask to see an operations dashboard they designed, and which screen its users open first.
- Ask how they decide what's an alert. A good answer starts from your actions, not your data.
- Ask how they handle stale data. Position age should come up without prompting.
- Ask who turns the design into code and how the build stays true to the screens.
- Ask who owns the code, map keys and data. All of them belong in your company's name.
Frequently asked questions
What should a fleet management dashboard include?
A live map, vehicle status, alerts, maintenance, drivers, fuel or charge, and reports, with four or five KPI cards on the overview and an action on every alert.
What KPIs should a fleet dashboard show first?
The few a manager checks every morning. FleetPulse leads with total active vehicles, daily deliveries, on-time rate and cost per mile, each compared with last week.
Should I build custom fleet software or buy an off-the-shelf tool?
Off-the-shelf suits standard needs. Custom makes sense when your workflows or data sources don't fit, or when you're building a product for other fleets. In the intro call I help you work out which applies.
Can a fleet dashboard work on a tablet?
It should. FleetPulse's main views were designed for desktop and tablet.
How long does fleet management software development take?
It depends on views, roles and integrations. I set the timeline in the written scope once the data sources are known.
Can you design and build the dashboard?
Yes. I design the product and build web apps in React and Next.js, plus a React Native or Flutter driver app if needed, with a design system so the code matches the design.
Sources and method
I read every source on 1 November 2026. ATRI's report page asks for a form before download, so its figures come from Transport Topics' report of the study. Regulations are quoted from the Legal Information Institute's copy of the Code of Federal Regulations; check the current text and exceptions for your fleet.
- Legal Information Institute, 49 CFR 396.11, Driver vehicle inspection reports, date read 1 November 2026: law.cornell.edu
- Legal Information Institute, 49 CFR 395.8, Driver's record of duty status, date read 1 November 2026: law.cornell.edu
- US Bureau of Labor Statistics, Occupational Outlook Handbook, Software Developers, date read 1 November 2026: bls.gov
- Google Maps Platform, core services pricing list, date read 1 November 2026: developers.google.com
- Transport Topics, Truck operating costs rose 3.4% in 2025, ATRI finds (17 July 2026), date read 1 November 2026: ttnews.com
- American Transportation Research Institute, Analysis of the Operational Costs of Trucking: 2026 Update, date read 1 November 2026: truckingresearch.org
If you're planning a fleet management dashboard, for your own fleet or as a product for others, book a free 30 minute intro call. After it, you get a written scope and one fixed quote for the design and the build.
Tags: Fleet management, Logistics, Dashboards, Case study, Product design