
Overview
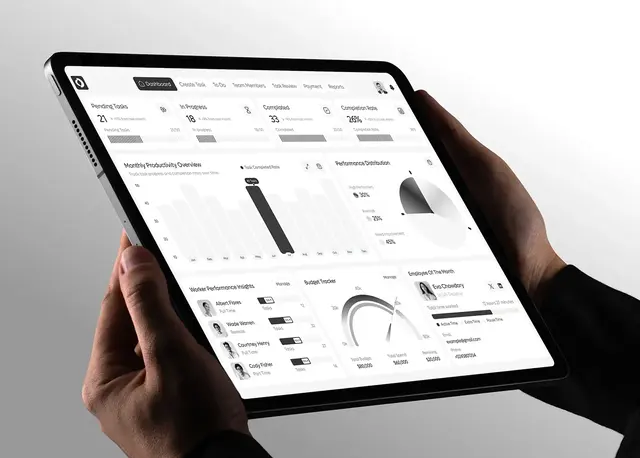
FleetPulse is a logistics dashboard for real-time control over vehicle networks, and this fleet management dashboard design case study shows how I shaped it. Fleet teams use it to track vehicles, plan routes and monitor performance. I designed the web dashboard for desktop and tablet, plus a marketing landing page that invites teams to try it.
The project overview places it in logistics and transportation, New York, USA. I worked in Figma, Illustrator and Photoshop.
The challenge
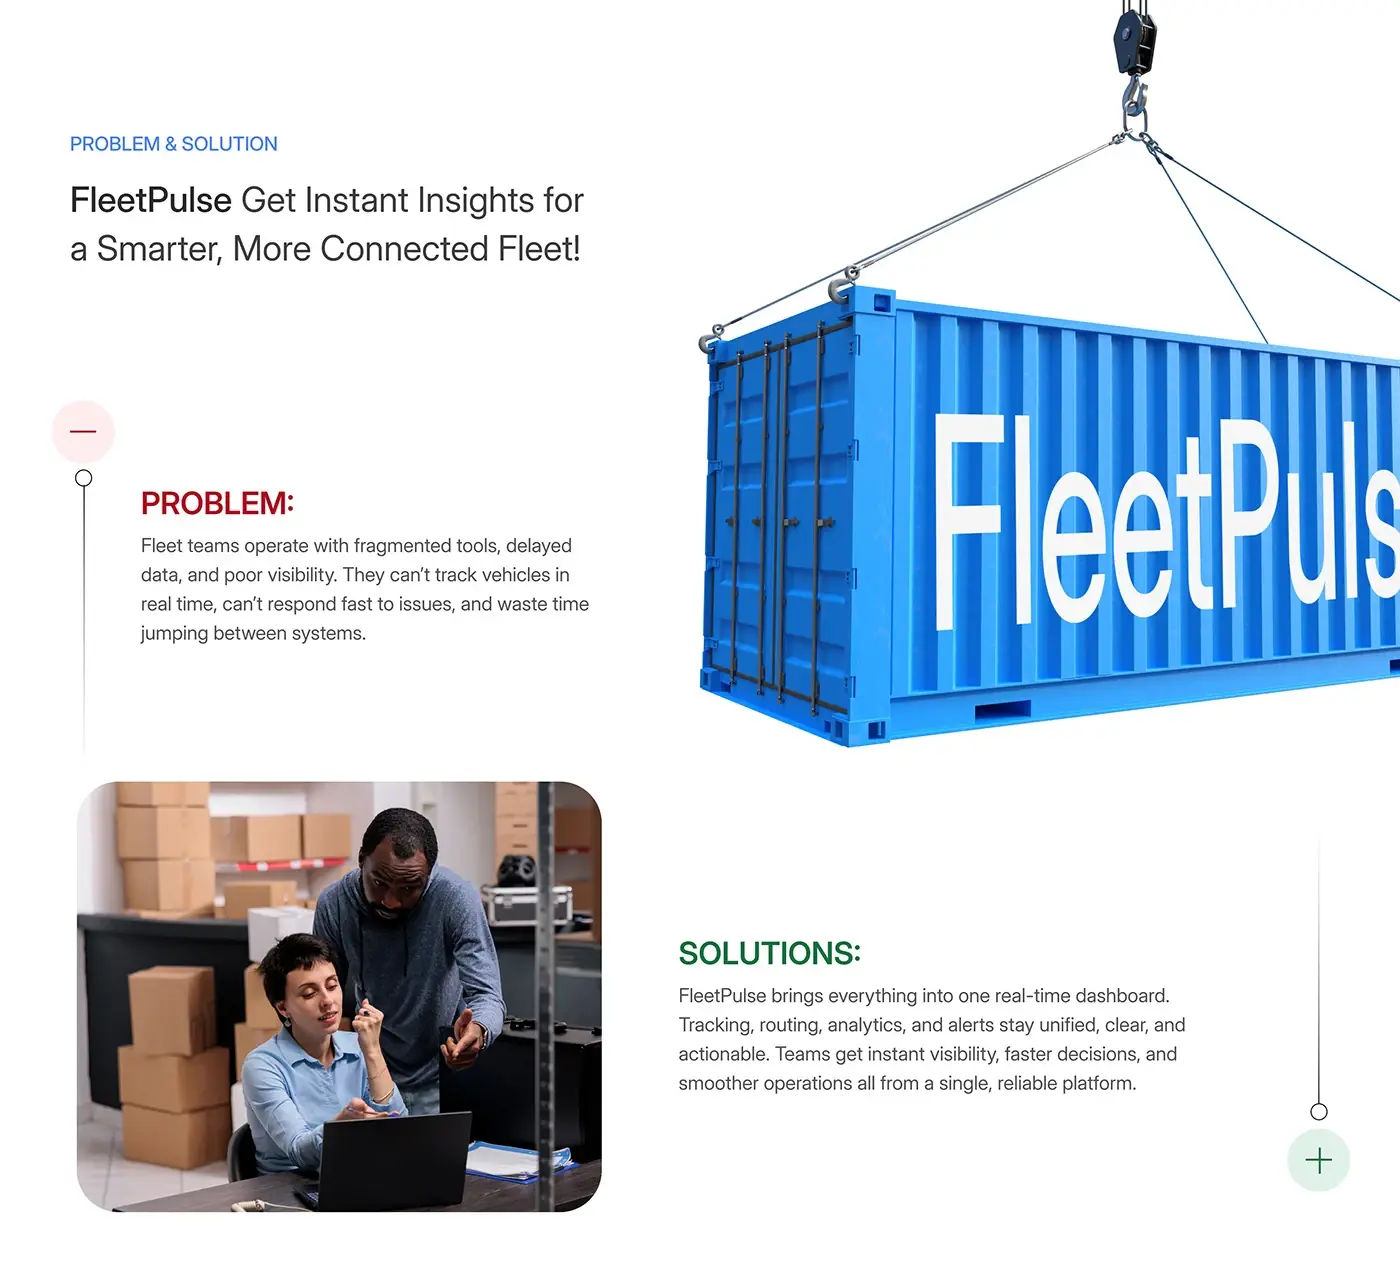
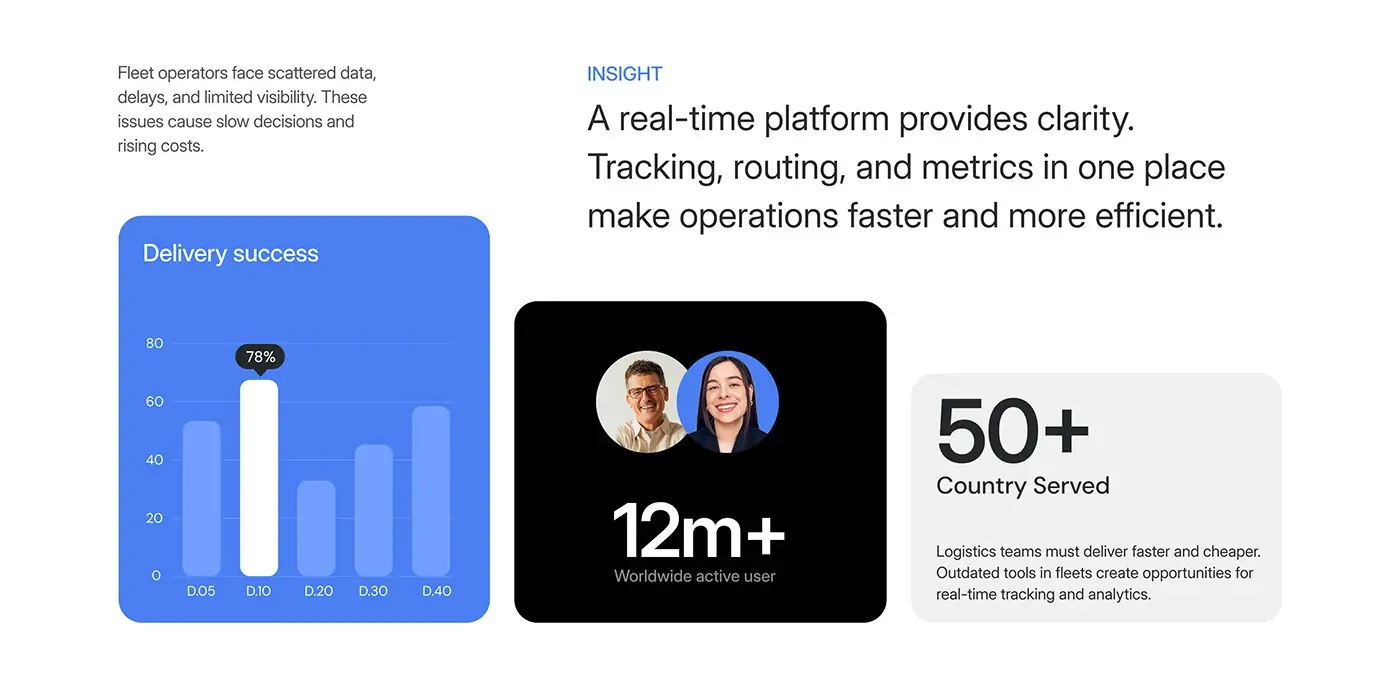
Fleet teams were working across fragmented tools, so the dashboard had to bring everything into one live view.
- Data arrived late, so teams couldn't track vehicles in real time.
- Poor visibility meant slow responses when something went wrong.
- Jumping between systems wasted time and slowed decisions.
- Many moving parts compete for attention.
The process
- Problem and insight: tracking, routing and metrics in one place.
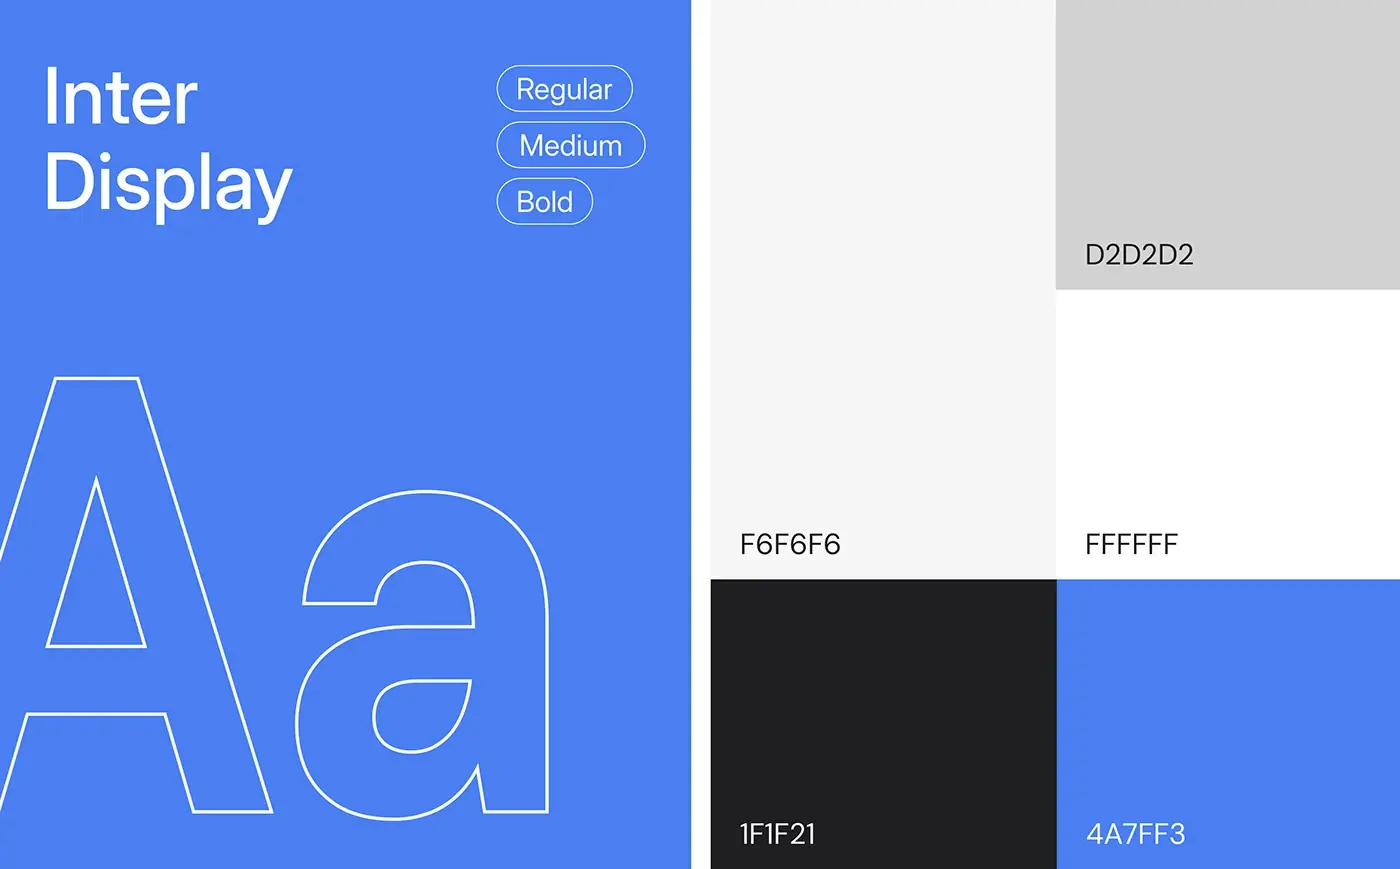
- Style guide: Inter Display in regular, medium and bold, a clear blue (#4A7FF3), light greys and near black.
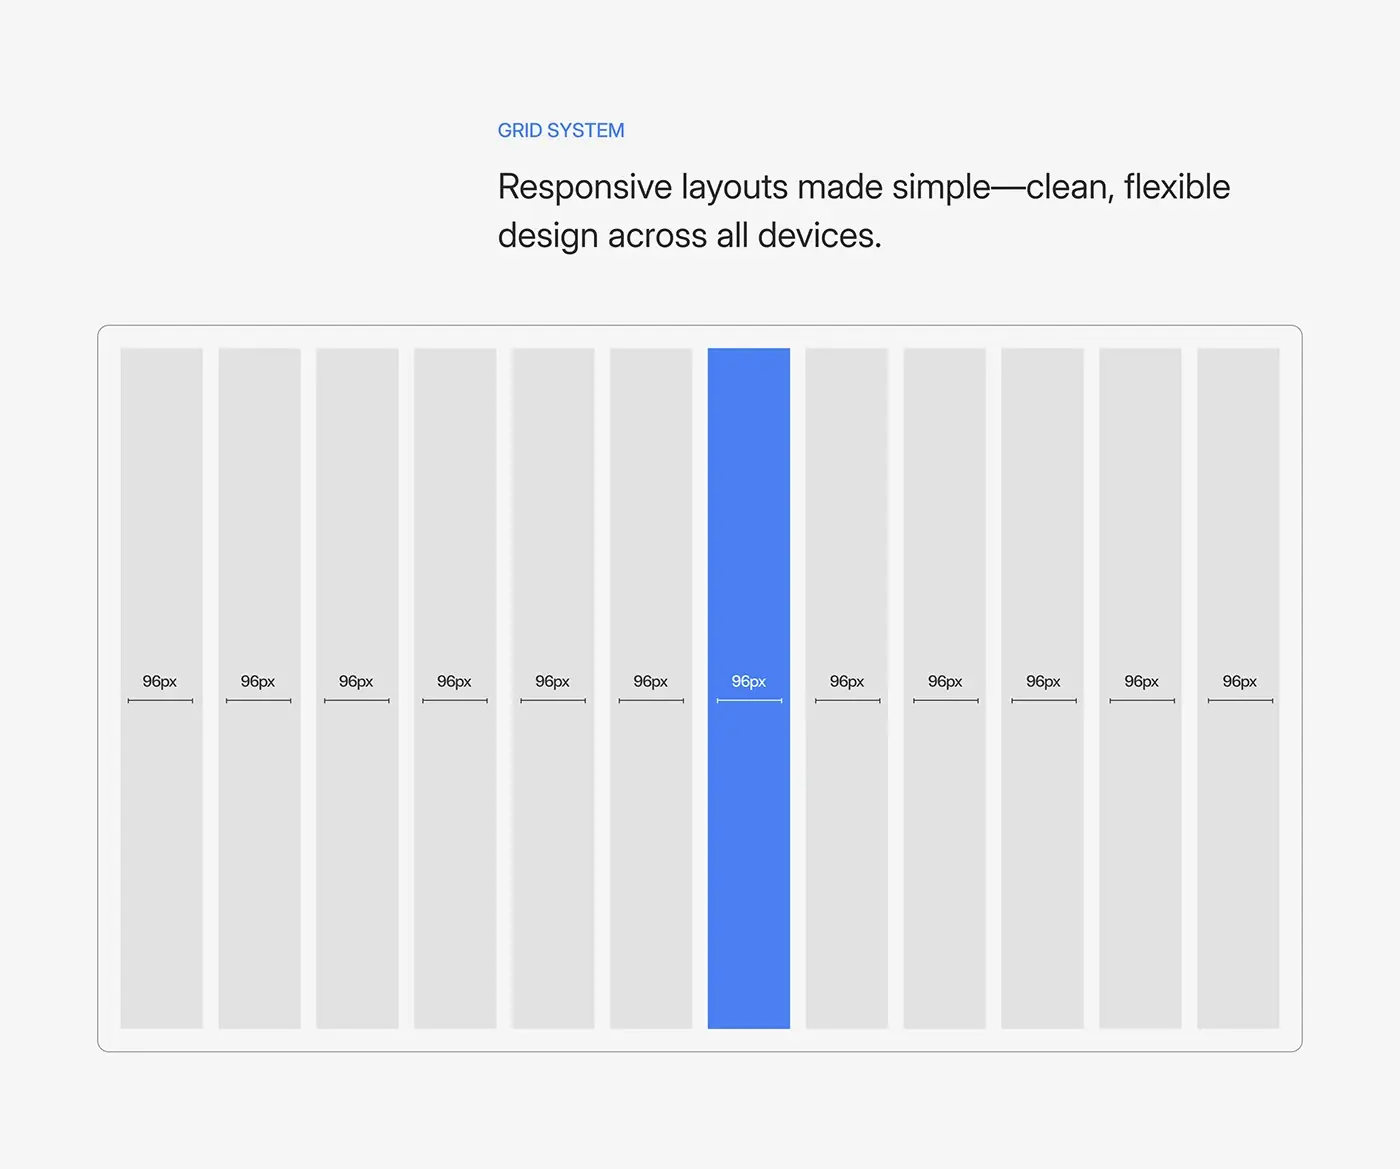
- A 12 column grid with 96 px columns, line icons and reusable cards for alerts, insights, drivers and storage.
- Dashboard, fleet management, tracking, analytics and inventory screens, on desktop and tablet.
- A landing page built around the product.
The solution
The interface makes exceptions loud and normal operations quiet, so attention goes where it's needed.
Main dashboard
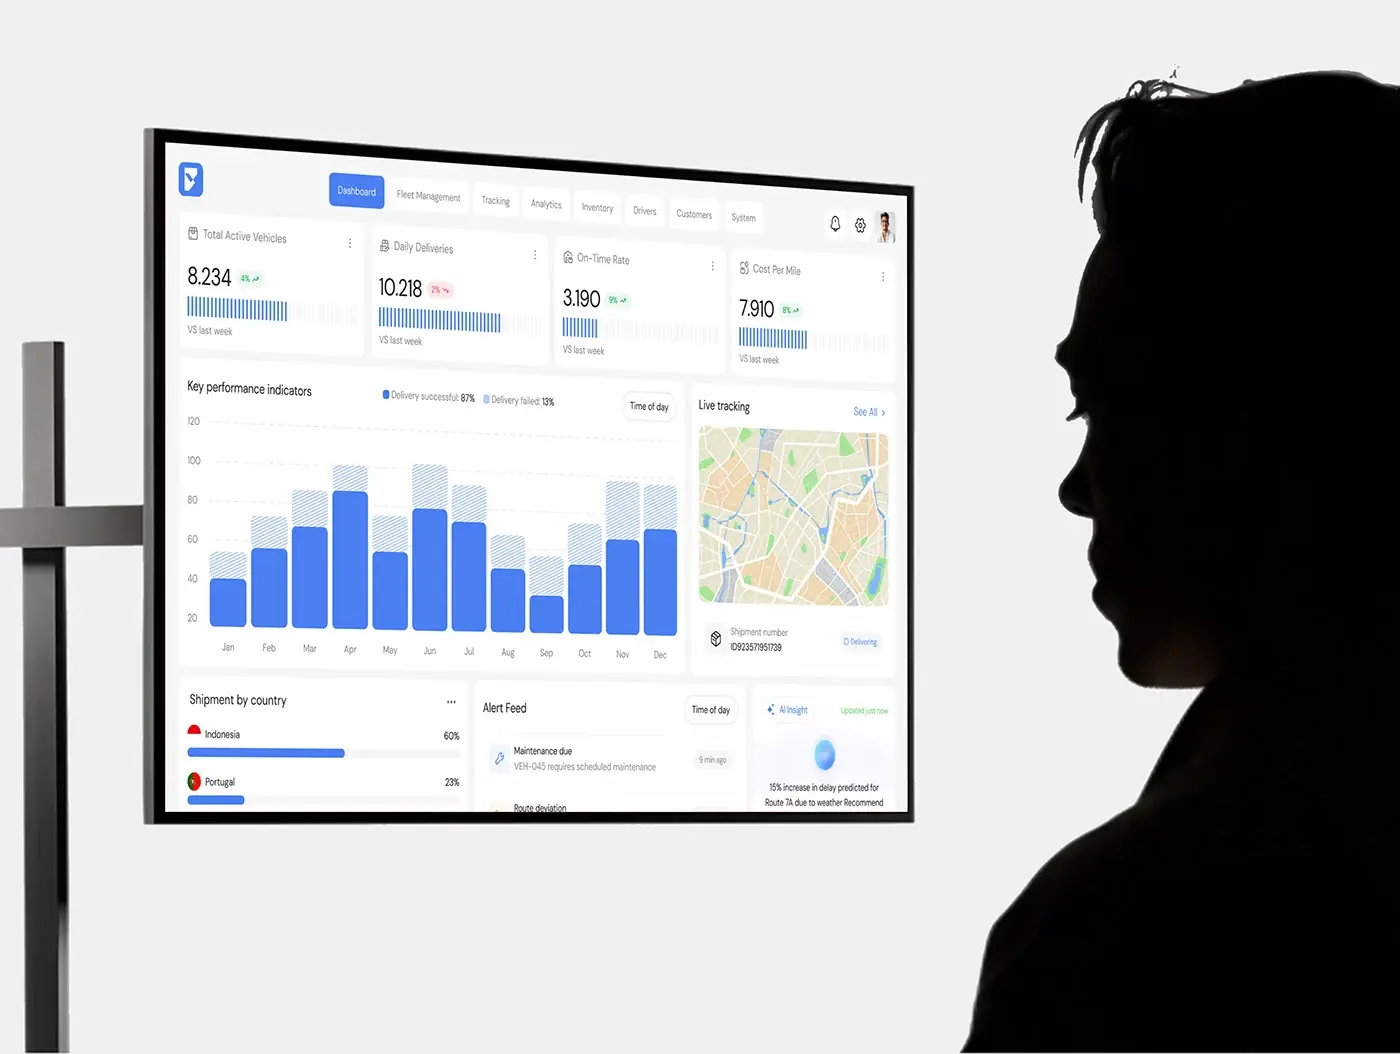
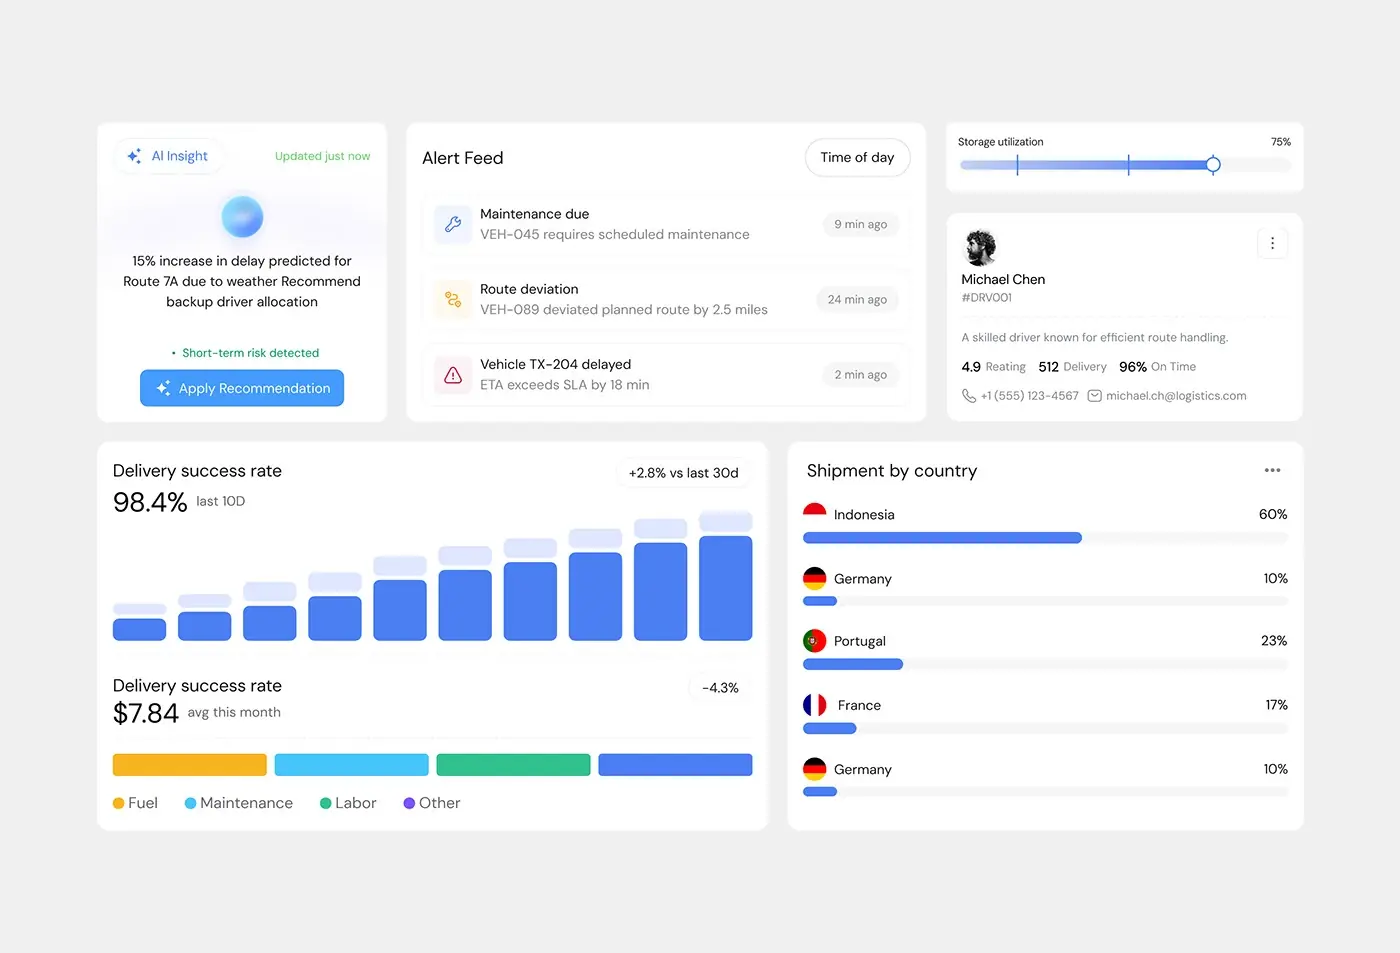
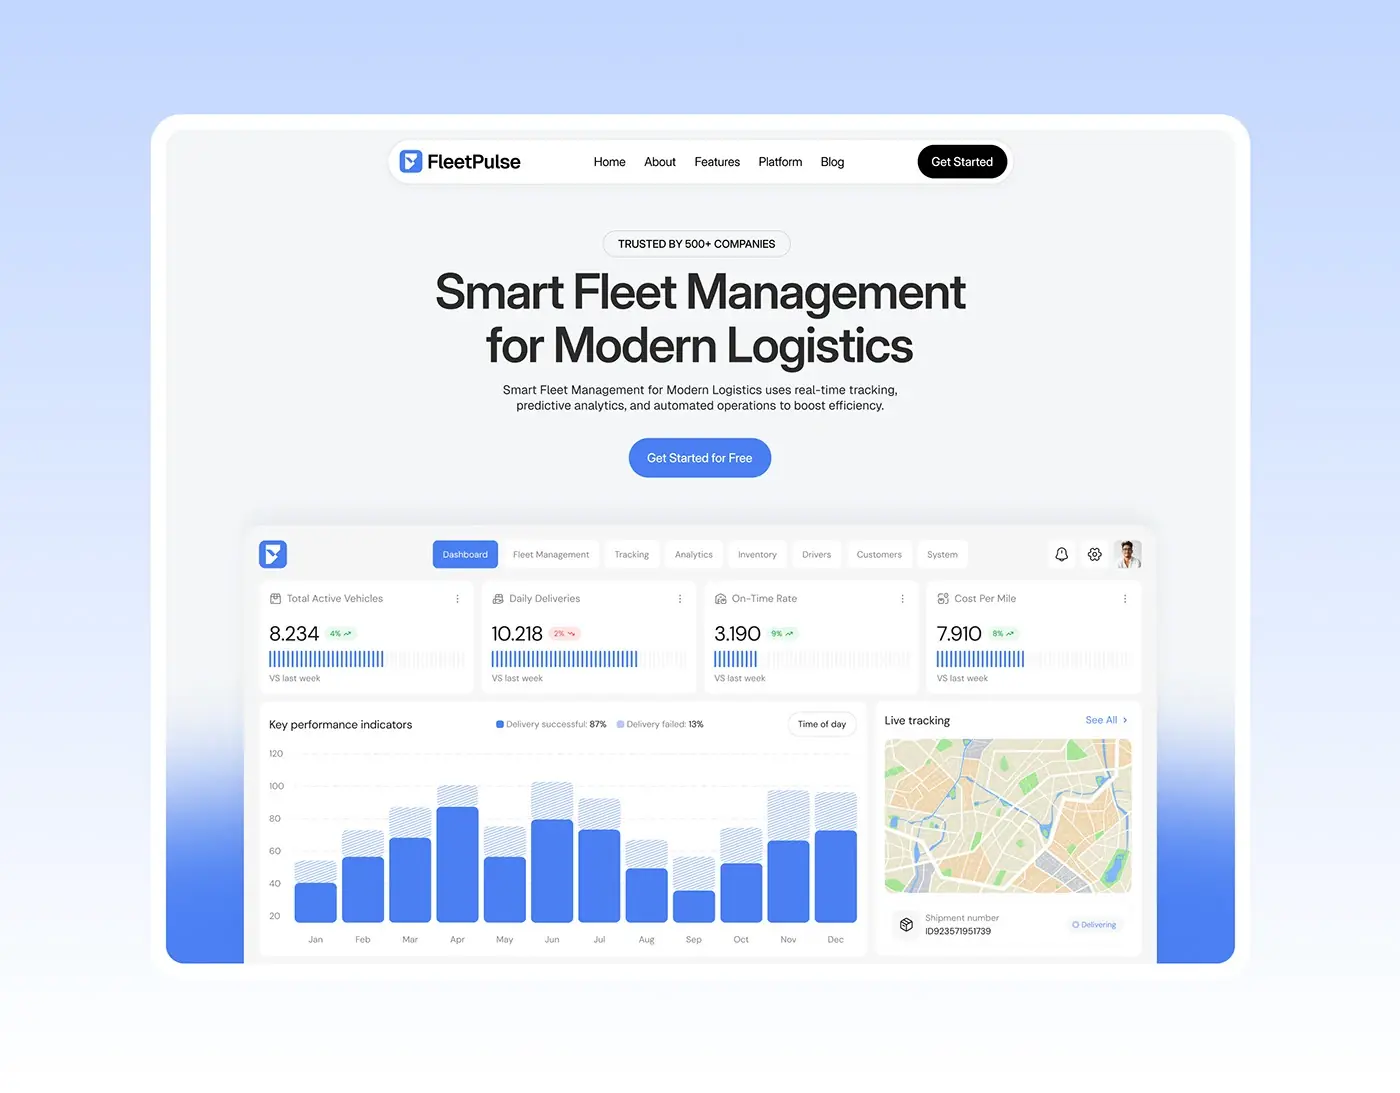
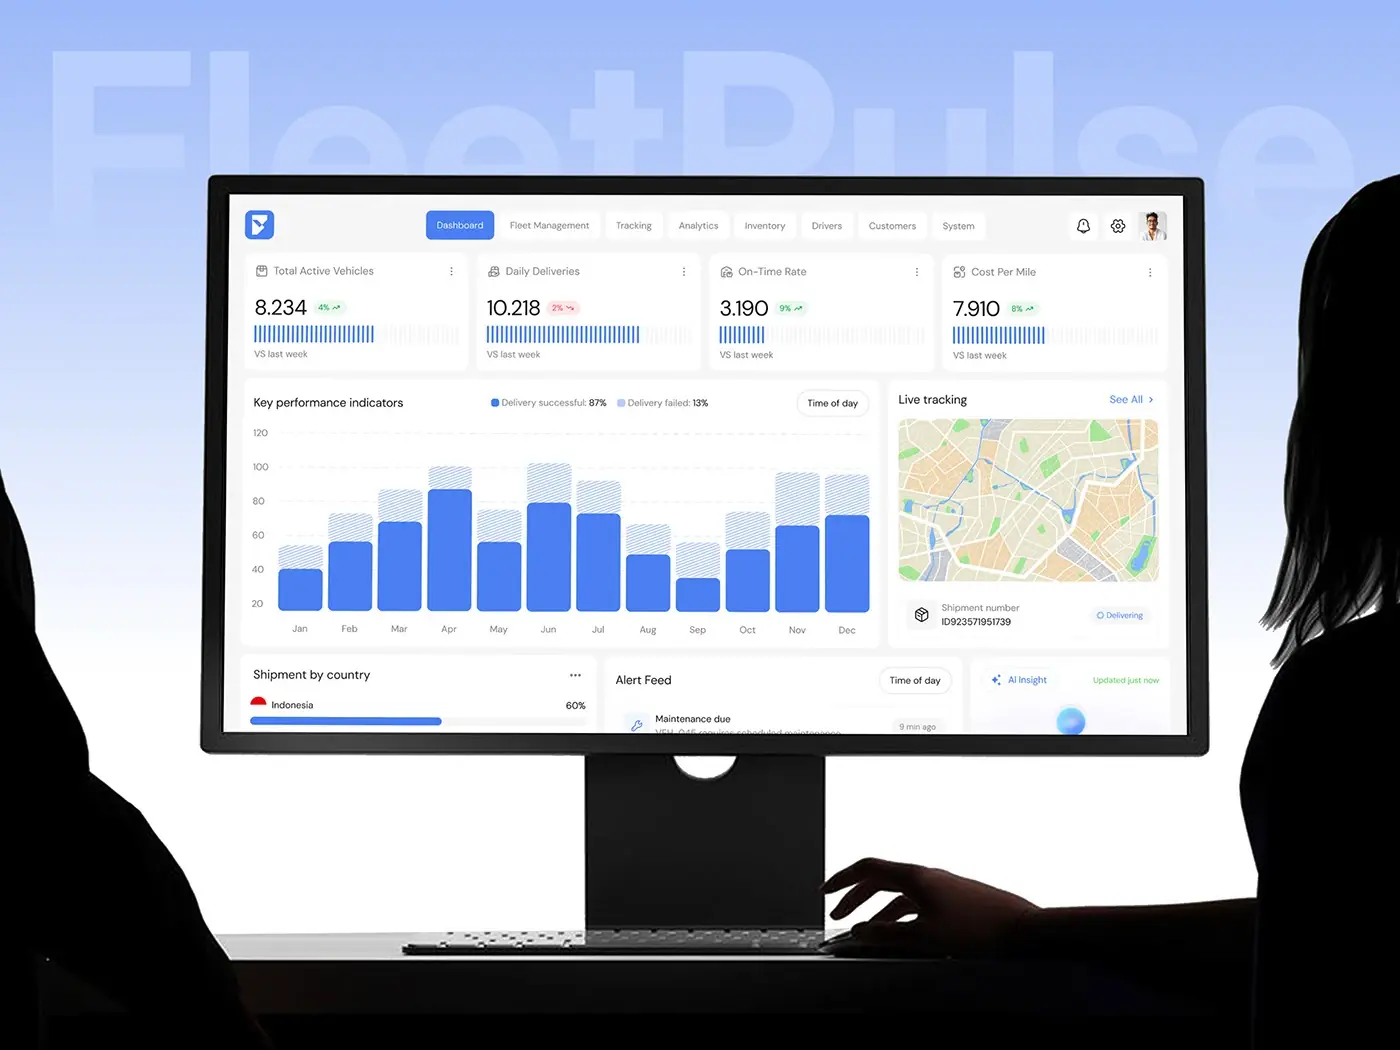
Four KPI cards run across the top: total active vehicles, daily deliveries, on-time rate and cost per mile, each with its change against last week. Below, a monthly chart splits successful and failed deliveries, beside a live tracking map with the current shipment. The bottom row holds shipment by country, the alert feed and an AI insight card. Numbers sit at the top, the map at eye level and exceptions just below.
Alert feed and AI insight
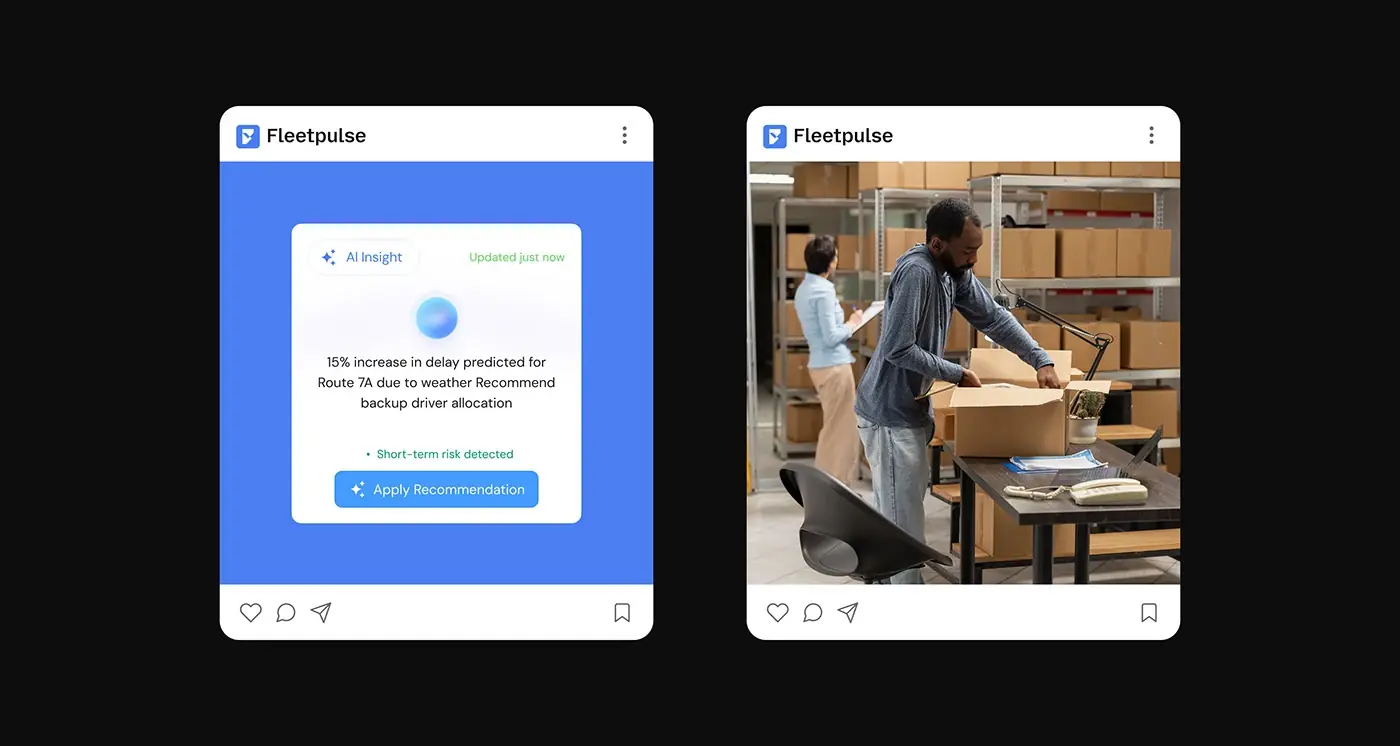
The alert feed lists maintenance due, route deviations and late vehicles, each with the vehicle code, a one-line reason and how long ago it happened. Next to it, the AI insight card predicts a weather delay on Route 7A and recommends a backup driver, with an Apply Recommendation button. Only alerts get tinted icons, so a problem is the first thing the eye finds.
Fleet management and route optimisation
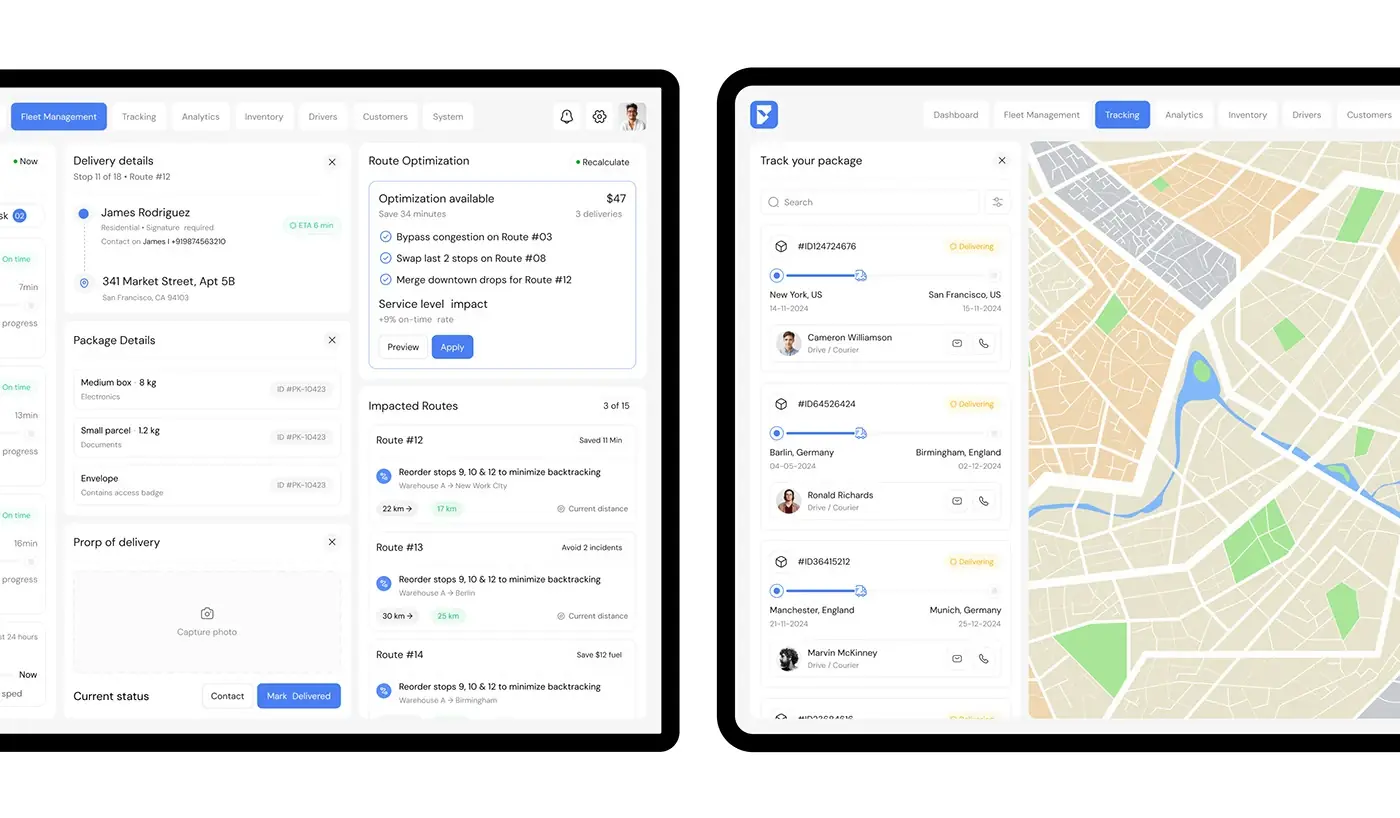
The fleet management view follows one delivery: stop 11 of 18 on route 12, the customer and address with an ETA, package details, a proof of delivery photo slot and Contact or Mark Delivered buttons. Beside it, route optimisation suggests changes with the minutes saved and the service level impact, then the impacted routes, ready to preview or apply. One screen holds the job in hand and the wider fix.
Package tracking
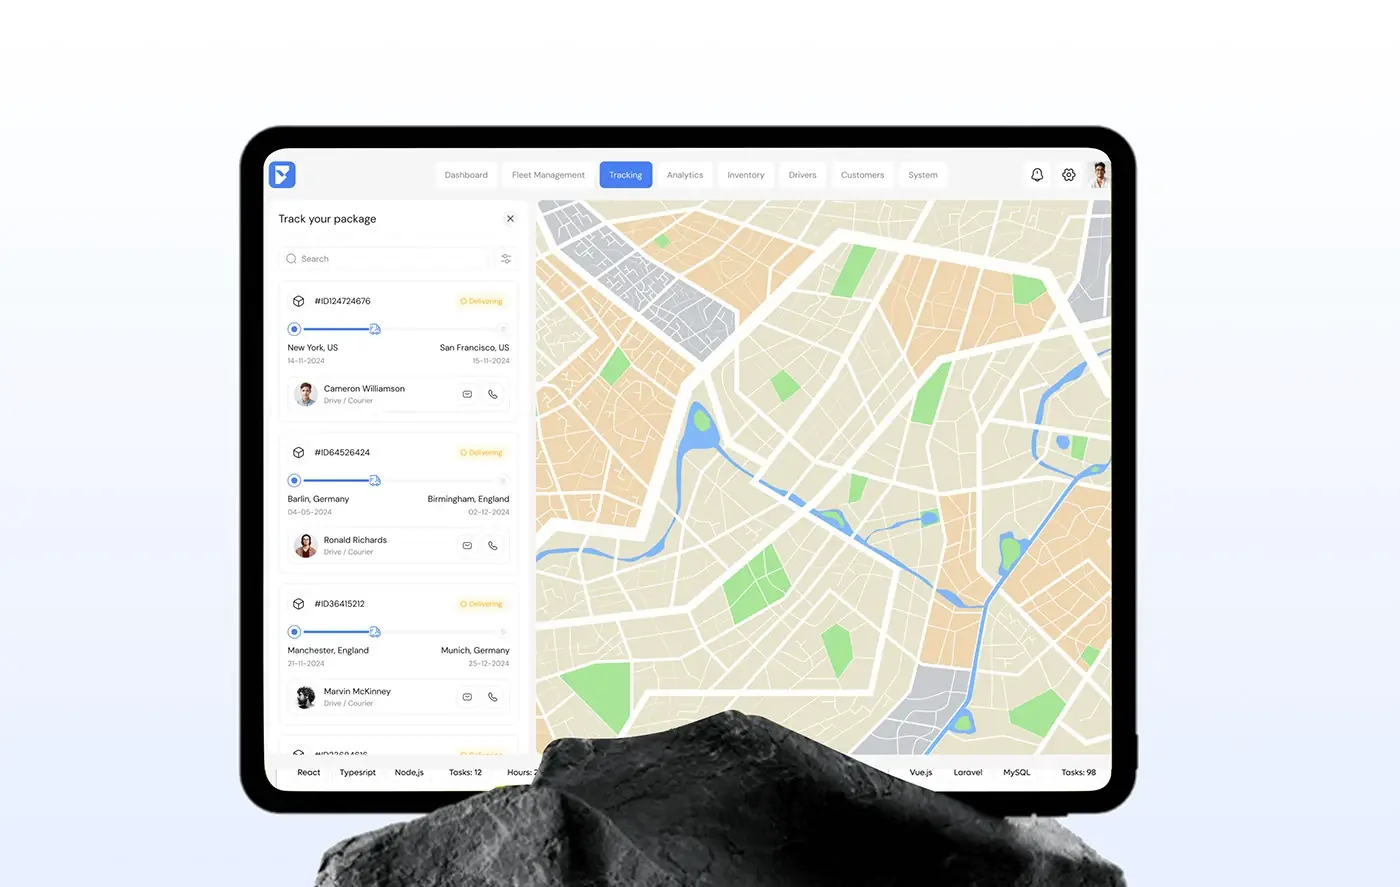
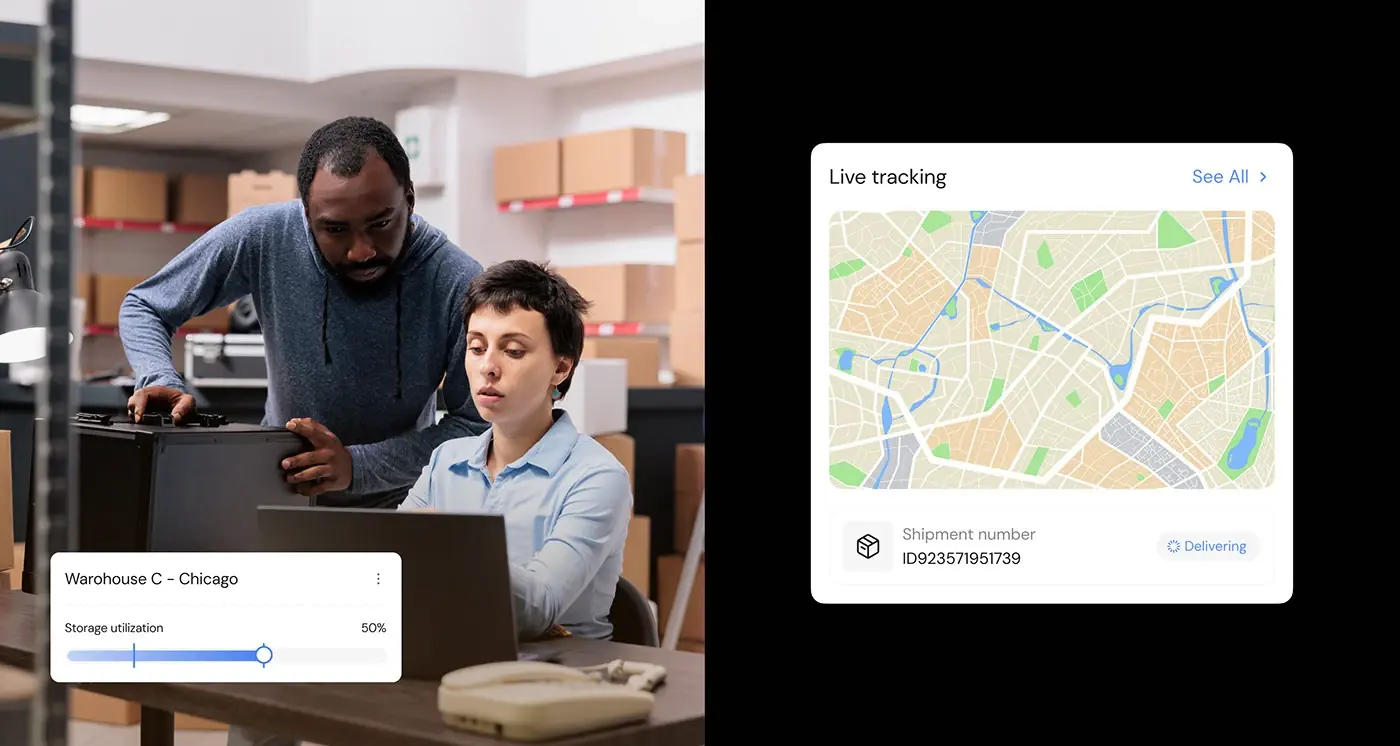
Tracking pairs a searchable package list with a full-height map. Each card shows the package ID, a Delivering status, the origin and destination cities with dates, a progress line and the courier, with message and call buttons. The list stays narrow on the left so the map gets most of the screen.
Analytics
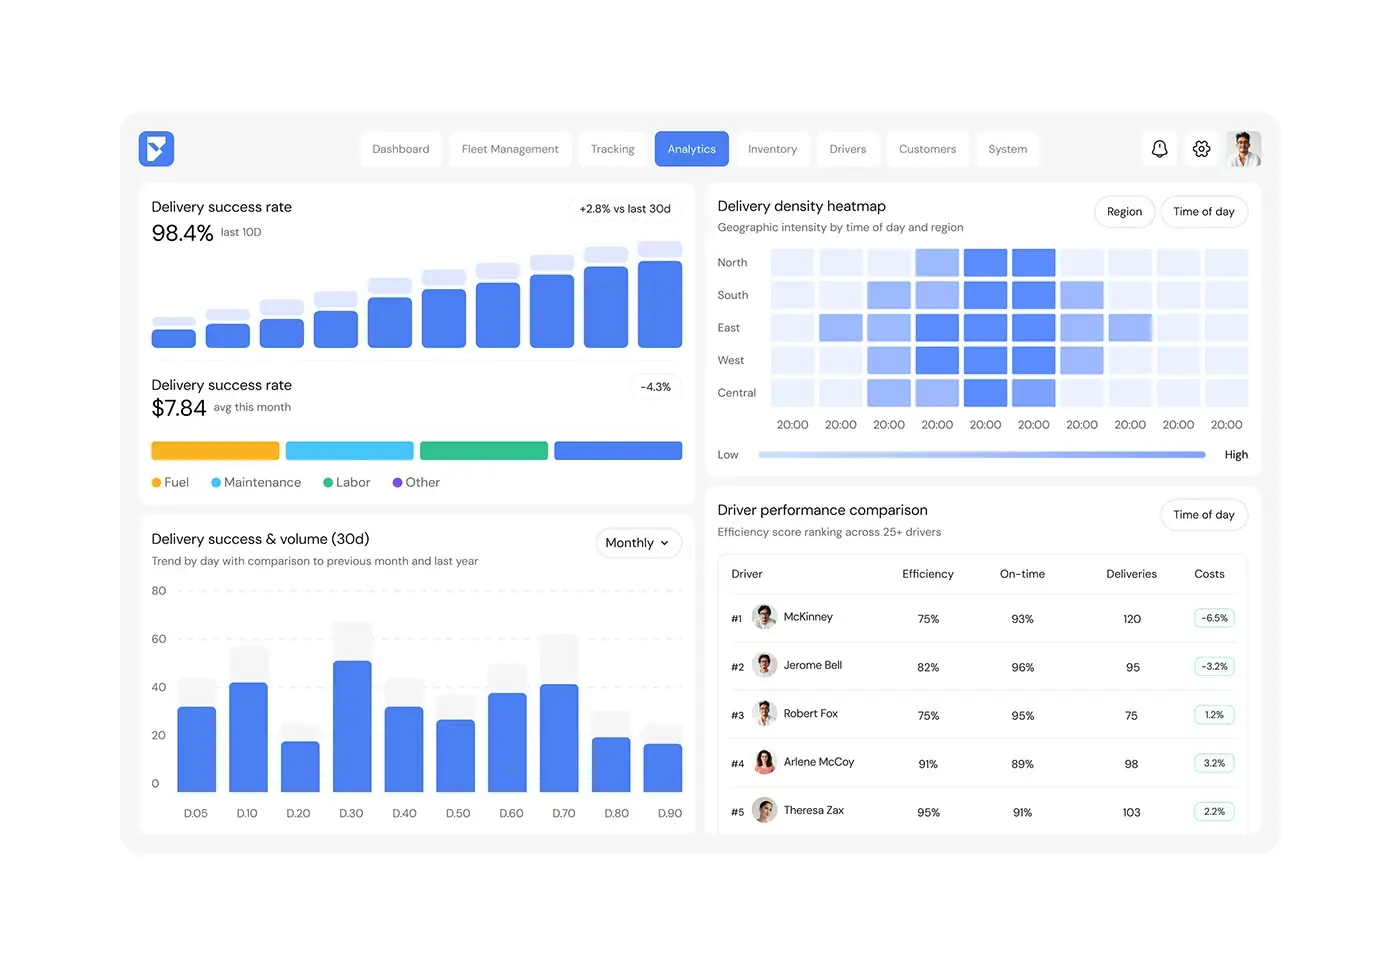
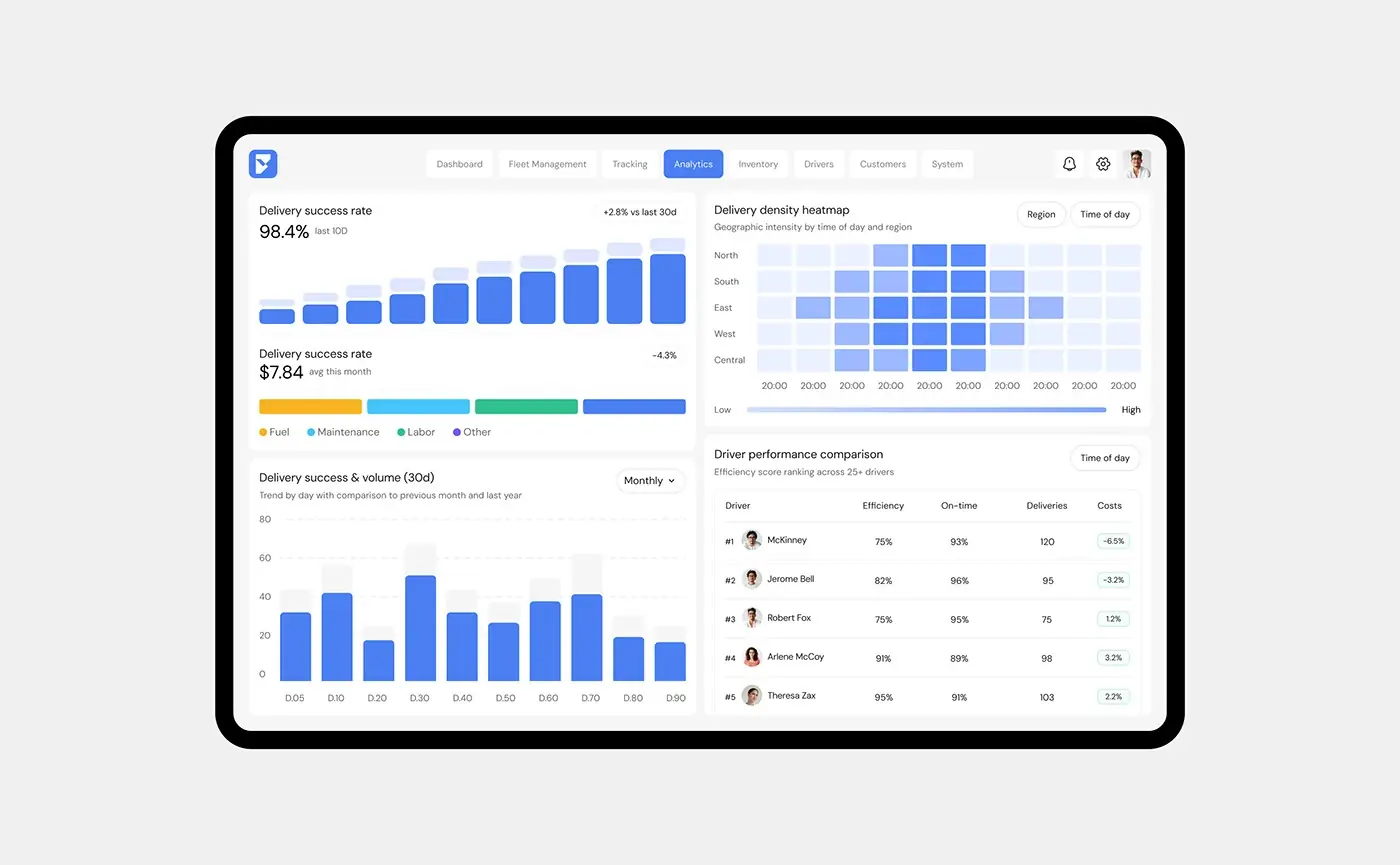
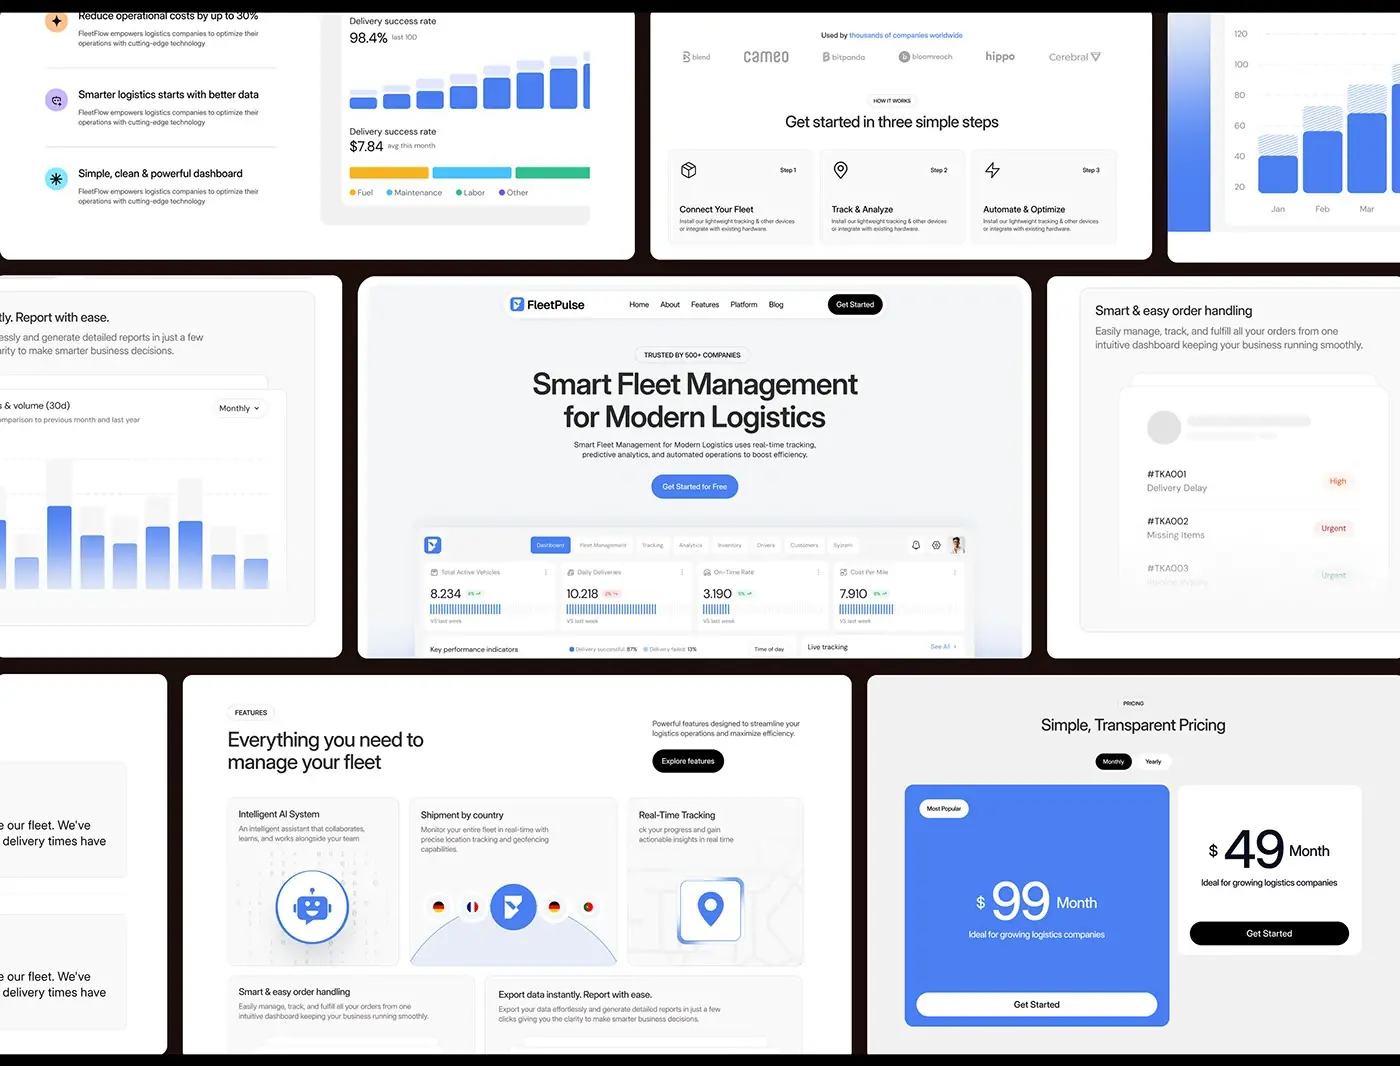
Analytics opens with the delivery success rate over the last ten days and its change against the last 30, then a cost bar split into fuel, maintenance, labour and other. A 30 day success and volume chart compares each day with the previous month and last year. On the right, a delivery density heatmap shows intensity by region and time of day, above a driver ranking with efficiency, on-time rate, deliveries and cost change.
Inventory and warehouse capacity
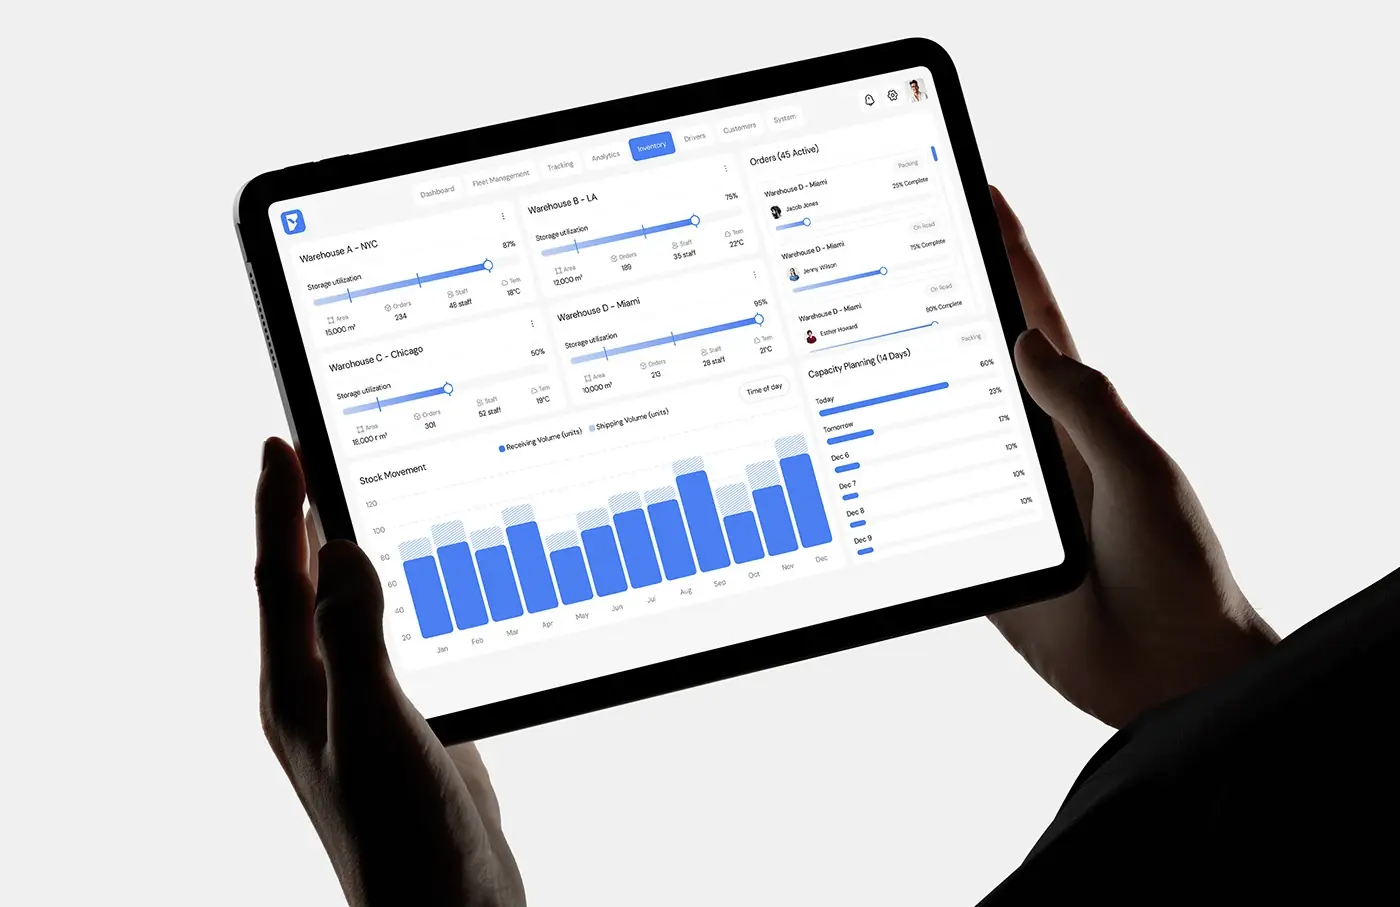
Inventory gives each warehouse (New York, Los Angeles, Chicago and Miami) a card with storage utilisation, area, orders, staff and temperature. An orders column tracks active orders by status, such as packing and on road, and a 14 day capacity plan lists the load for each day ahead. A stock movement chart compares receiving and shipping volume by month.
Landing page
The landing page leads with "Smart Fleet Management for Modern Logistics", one Get Started for Free button and the real dashboard beneath, so prospects see the product first. Further down come feature cards, three steps (Connect Your Fleet, Track & Analyze, Automate & Optimize), report export, order handling and plans with a monthly and yearly switch.
The result
- The web dashboard: overview, fleet management, tracking, analytics and inventory, on desktop and tablet.
- A landing page with a product-led hero, features, a three step how it works and plans.
- A UI style guide: type, colour, a 12 column grid, line icons and reusable cards.
How it helps the client
A fleet manager can see live status, spot a late vehicle and act on it from one screen, instead of switching between systems. Reusable cards mean menu areas such as Drivers and Customers can follow in the same style. The landing page shows prospects the real product before they sign up. That's what I aim for in product design for logistics dashboards, and you can compare it with my other dashboard case studies.