
Overview
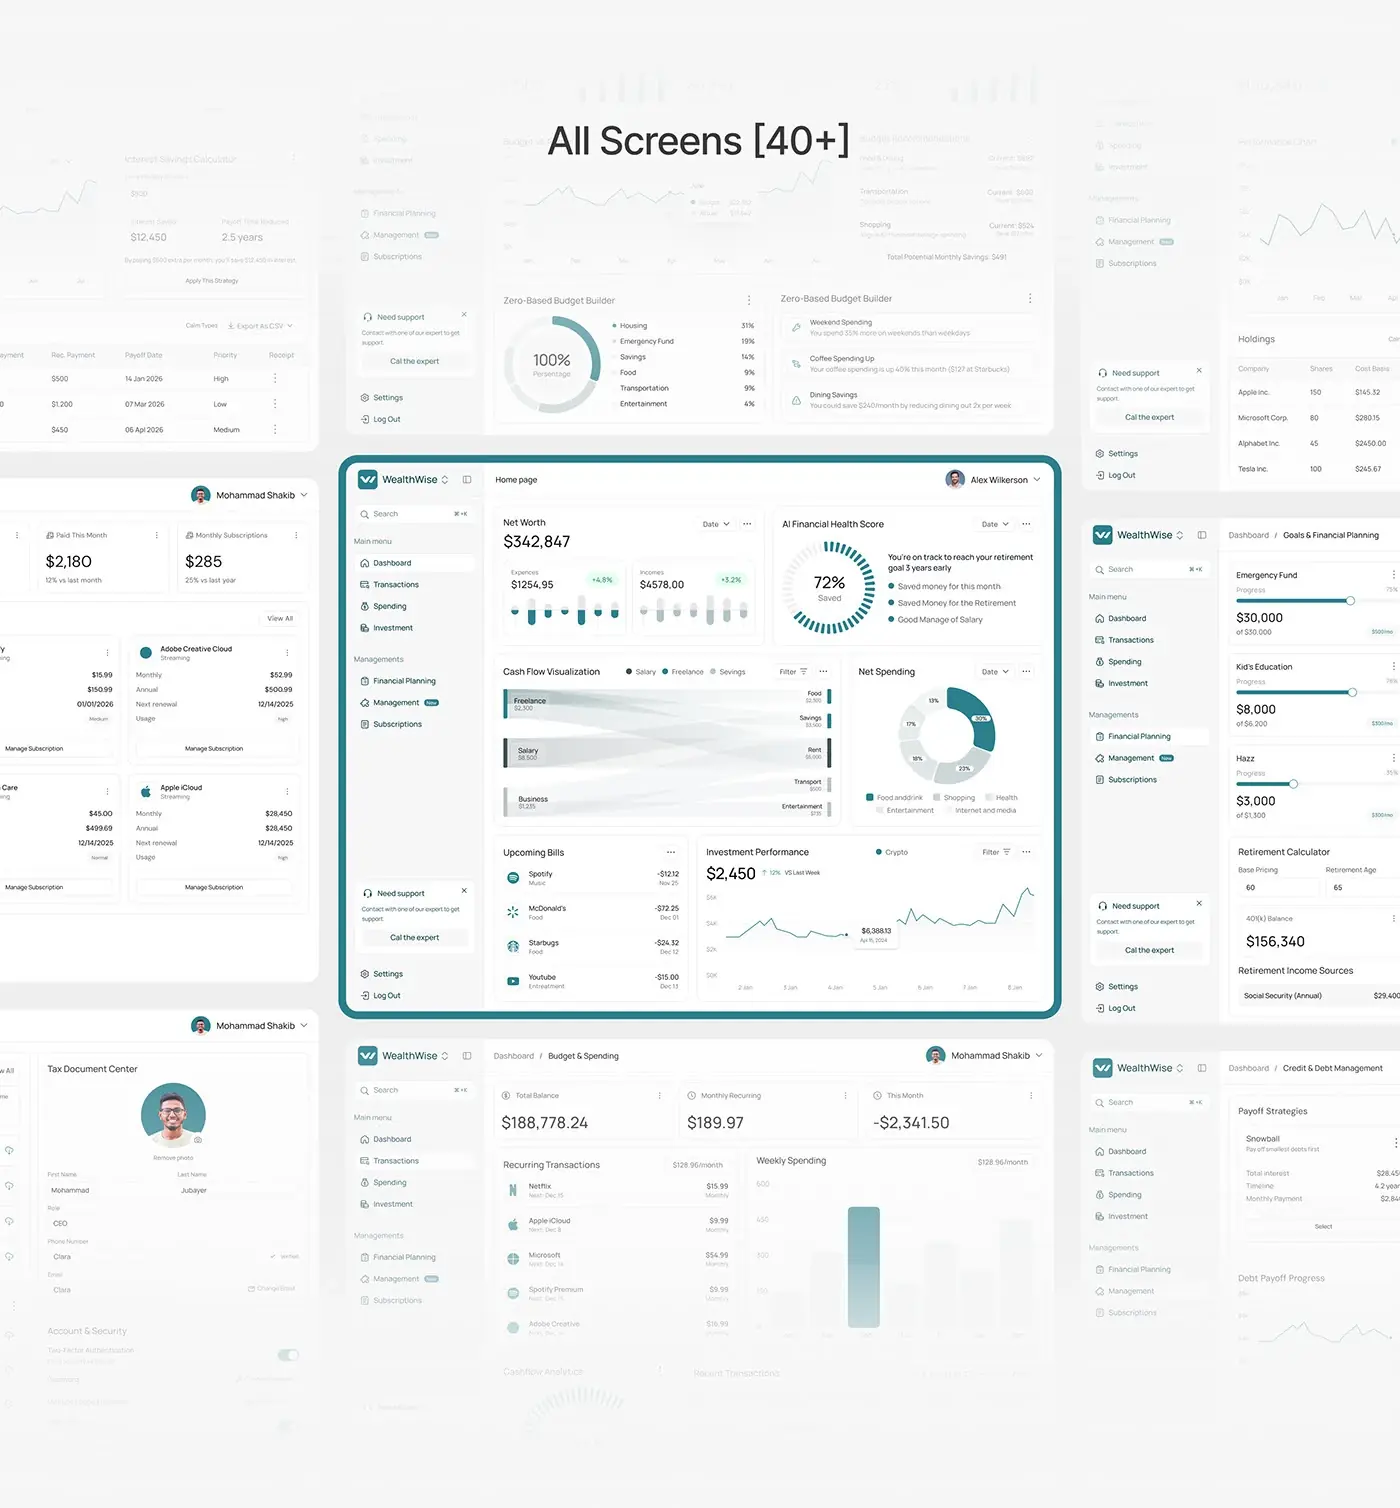
WealthWise is an AI personal finance dashboard: people use it to monitor cash flow, investments and financial goals in one place, with AI insights alongside. This personal finance dashboard design runs to more than 40 web screens, from the home overview to budgets, subscriptions, debt and tax, plus a mobile layout of the home view. I designed all of it, with the style guide and design system behind it.
The challenge
Most people don't want more financial data; they want to know what to do next.
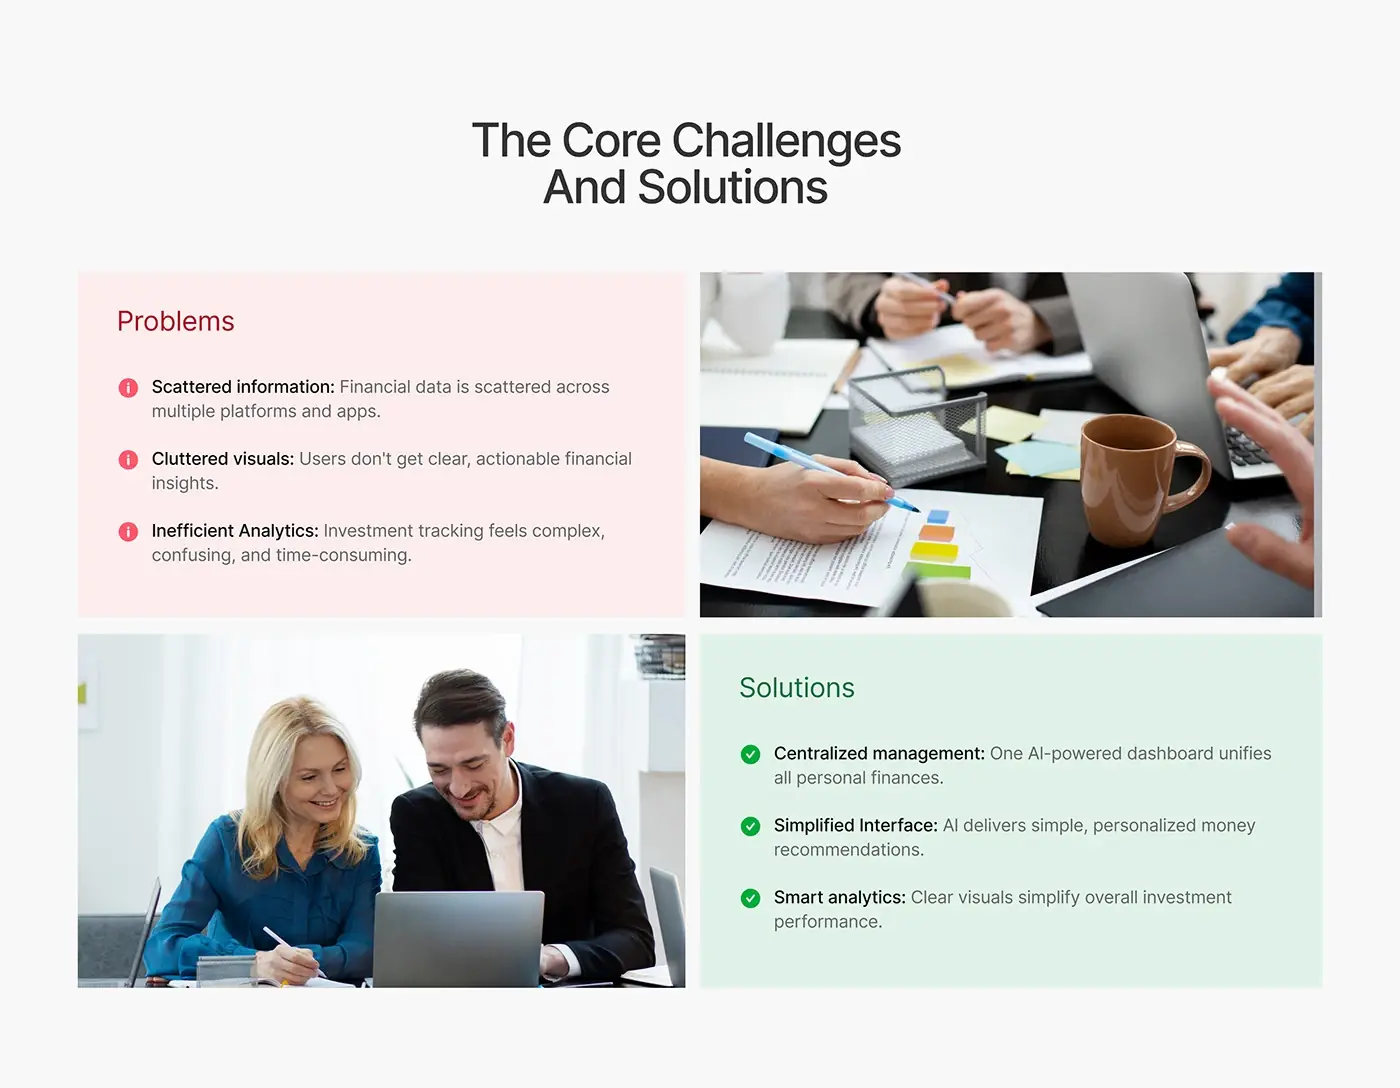
- Financial data was scattered across several platforms and apps.
- Cluttered visuals gave no clear, actionable insight.
- Investment tracking felt complex, confusing and slow.
Each problem set a goal: one AI-assisted dashboard for every account, simple personalised money recommendations, and charts that make investment performance readable at a glance.
The process
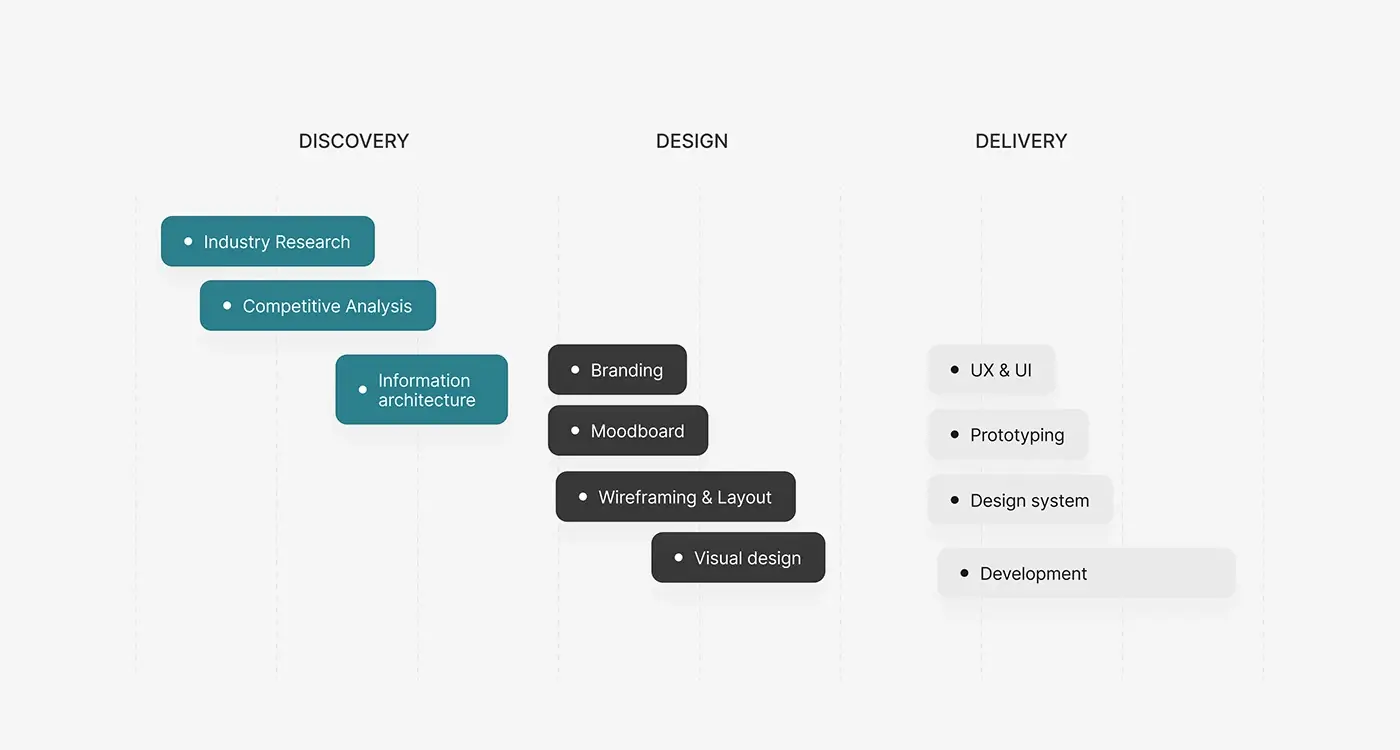
- Discovery: industry research, competitive analysis and information architecture.
- A moodboard, then wireframes and layout.
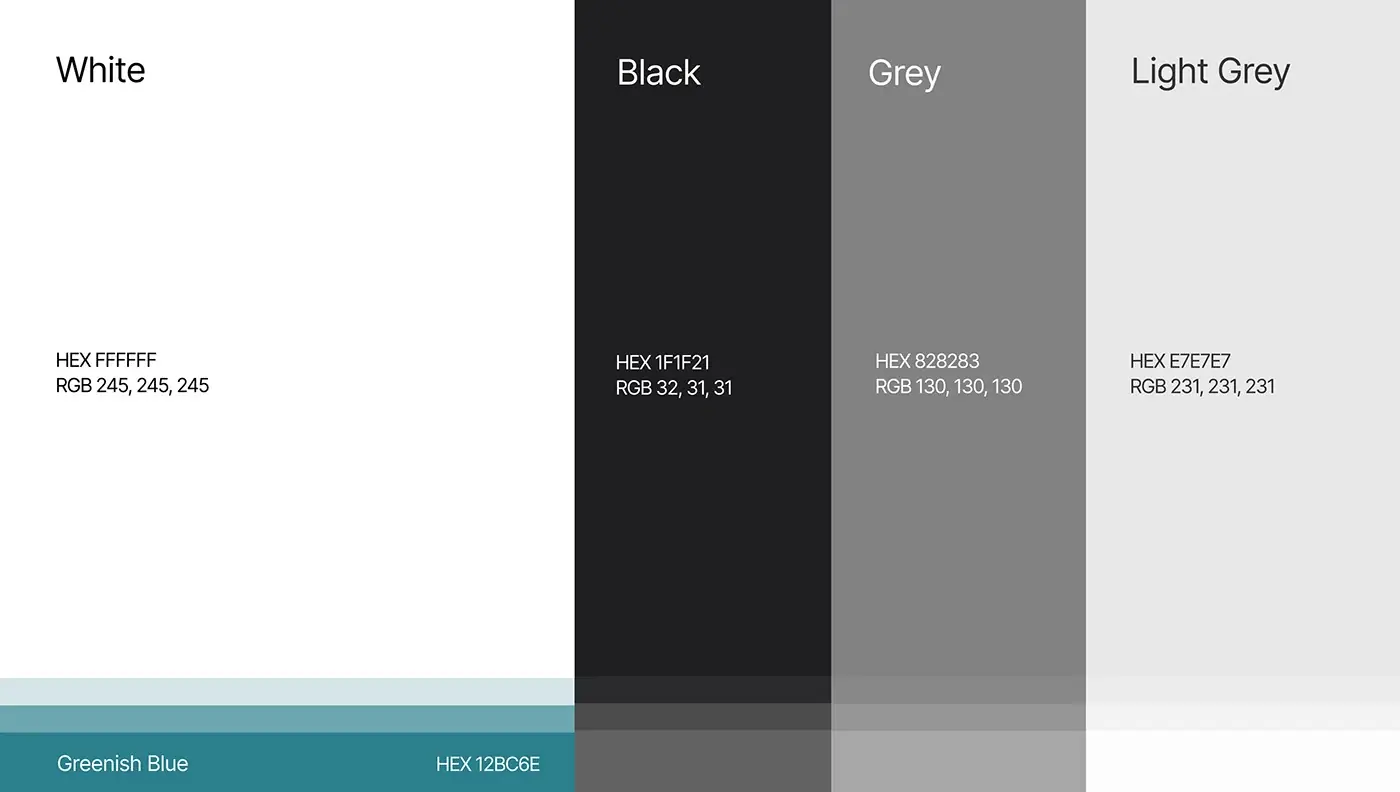
- Visual design: Manrope, white, black, two greys and a greenish blue accent.
- Design for every screen, a prototype and a design system.

The solution
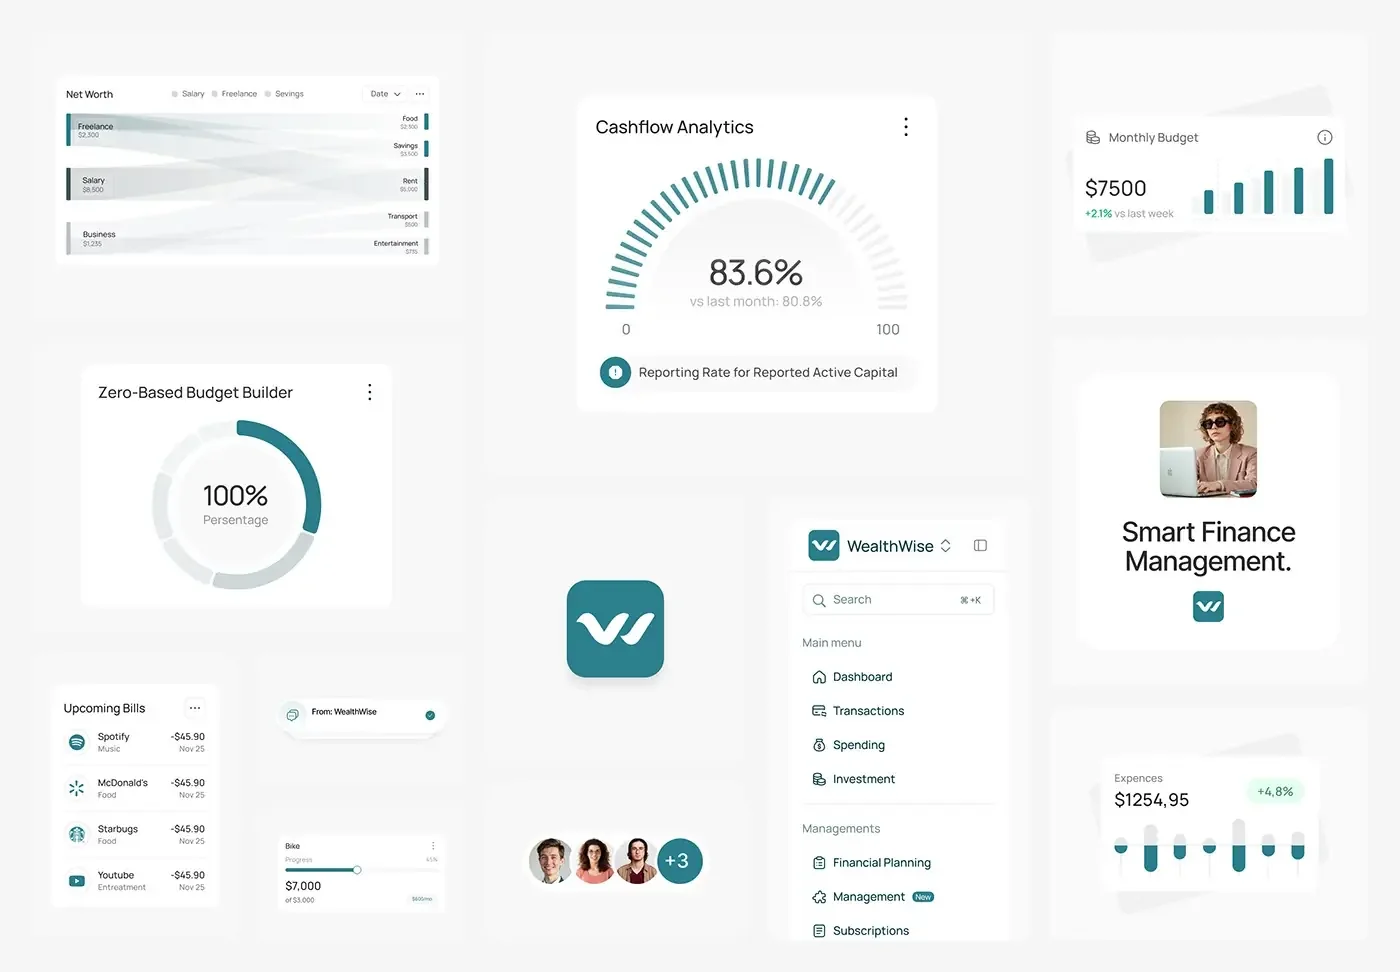
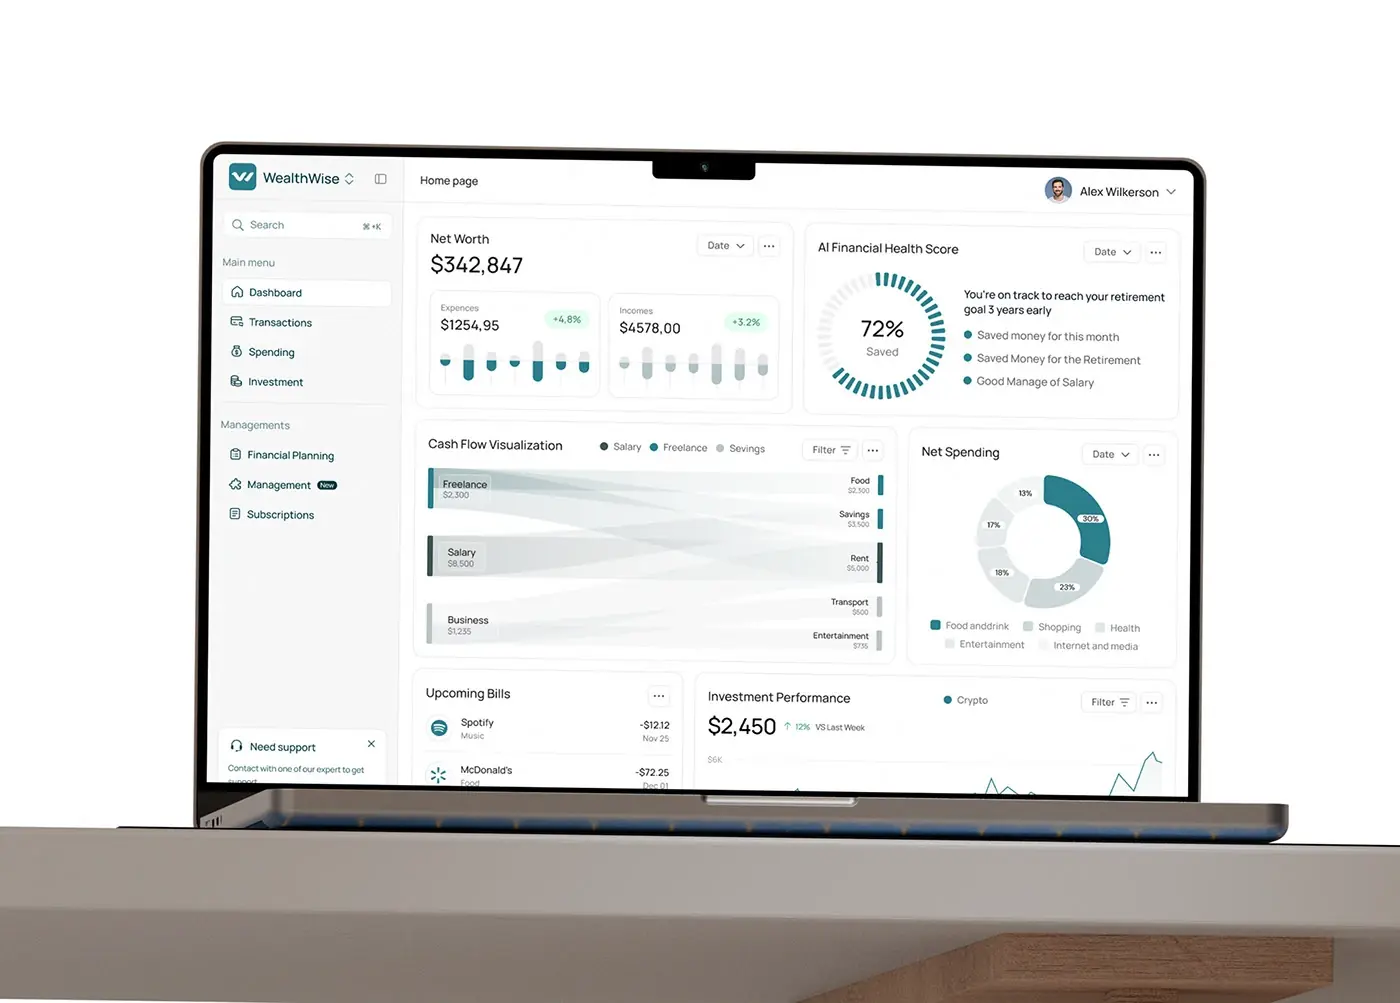
Each AI insight sits beside the numbers it comes from, phrased as a plain next step. A left sidebar splits the product into a main menu (dashboard, transactions, spending, investment) and management pages (financial planning, management, subscriptions).
Home overview
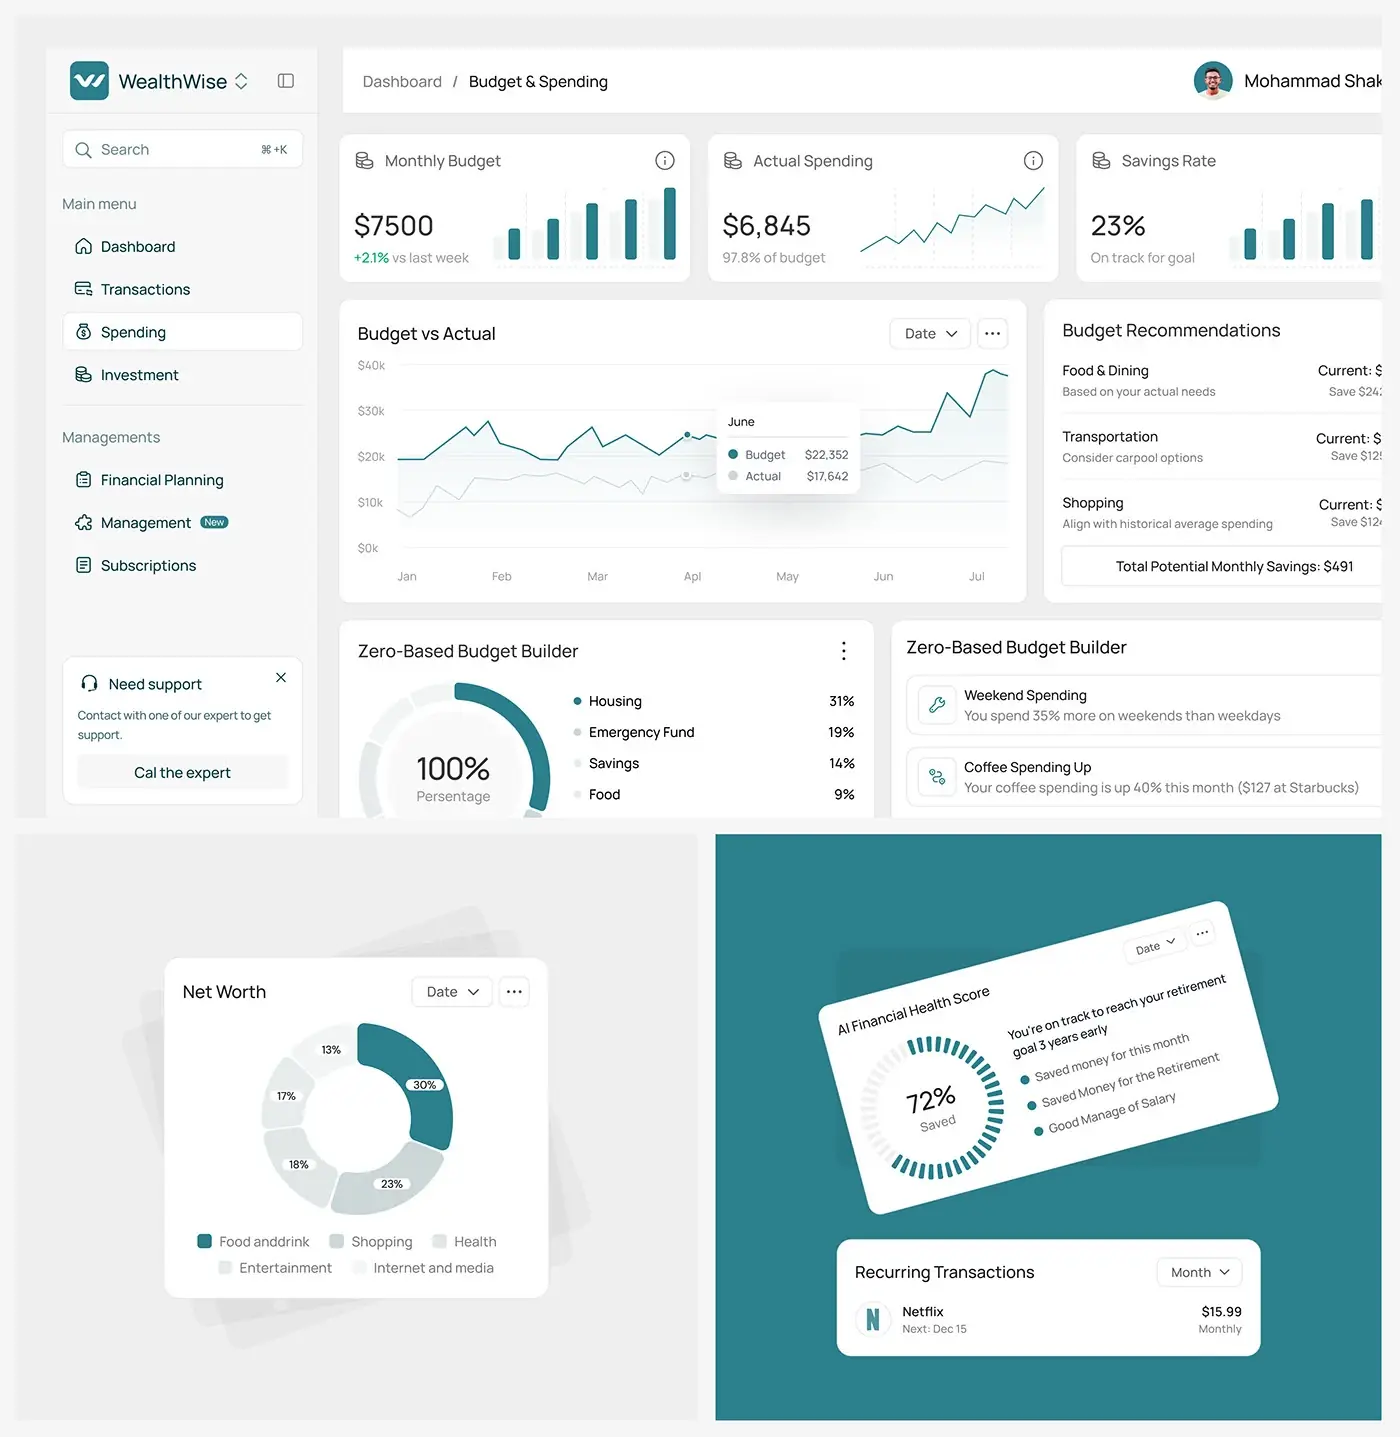
Net worth leads, with expenses and incomes beneath it, each showing its change. Beside it, an AI financial health score shows a 72% saved ring and a plain sentence, such as being on track to reach a retirement goal three years early. Net spending by category, upcoming bills and investment performance fill the rest, so the first screen answers "how am I doing" before any detail.
Cash flow view
A flow chart traces income from salary, freelance and business work into food, savings, rent, transport and entertainment. The width of each band shows its size, so the month reads at a glance without adding up rows. A legend and a filter sit above it, and nothing else competes inside the card.
Budget and spending
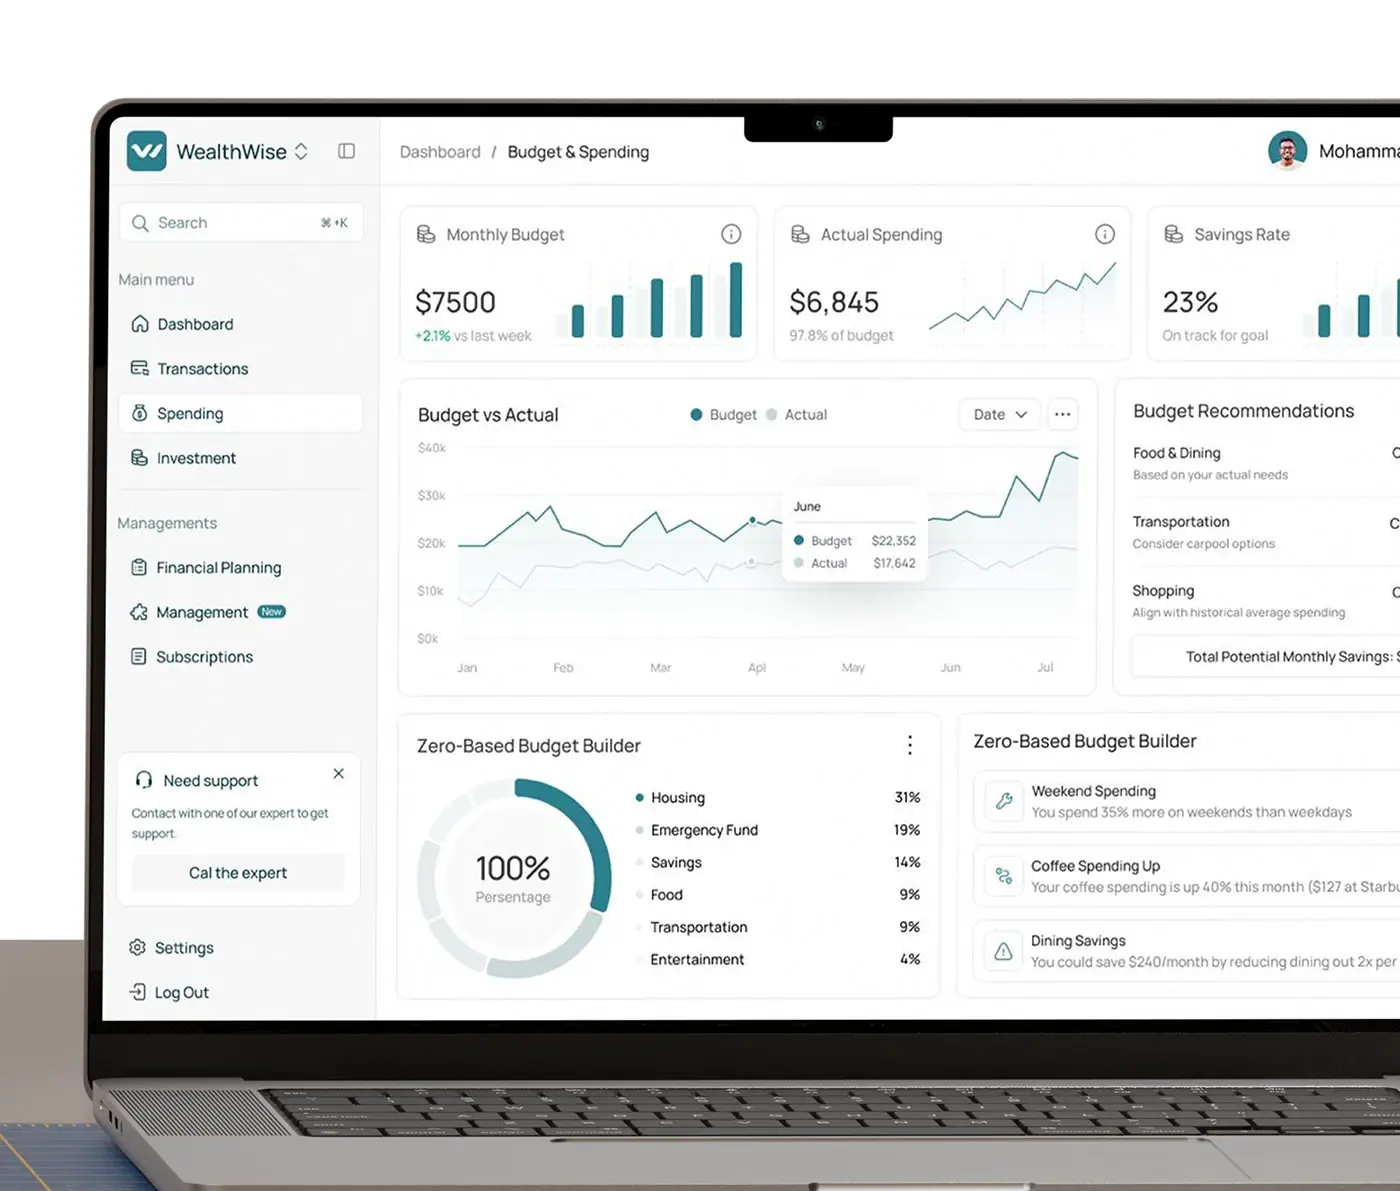
Monthly budget, actual spending and savings rate head the page, each with a small chart. A budget against actual chart runs across the middle, beside recommendations for dining, transport and shopping that add up the potential monthly savings. A zero-based budget builder splits income across housing, emergency fund, savings, food and more, with AI notes on weekend and dining habits next to it.
Transactions and subscriptions
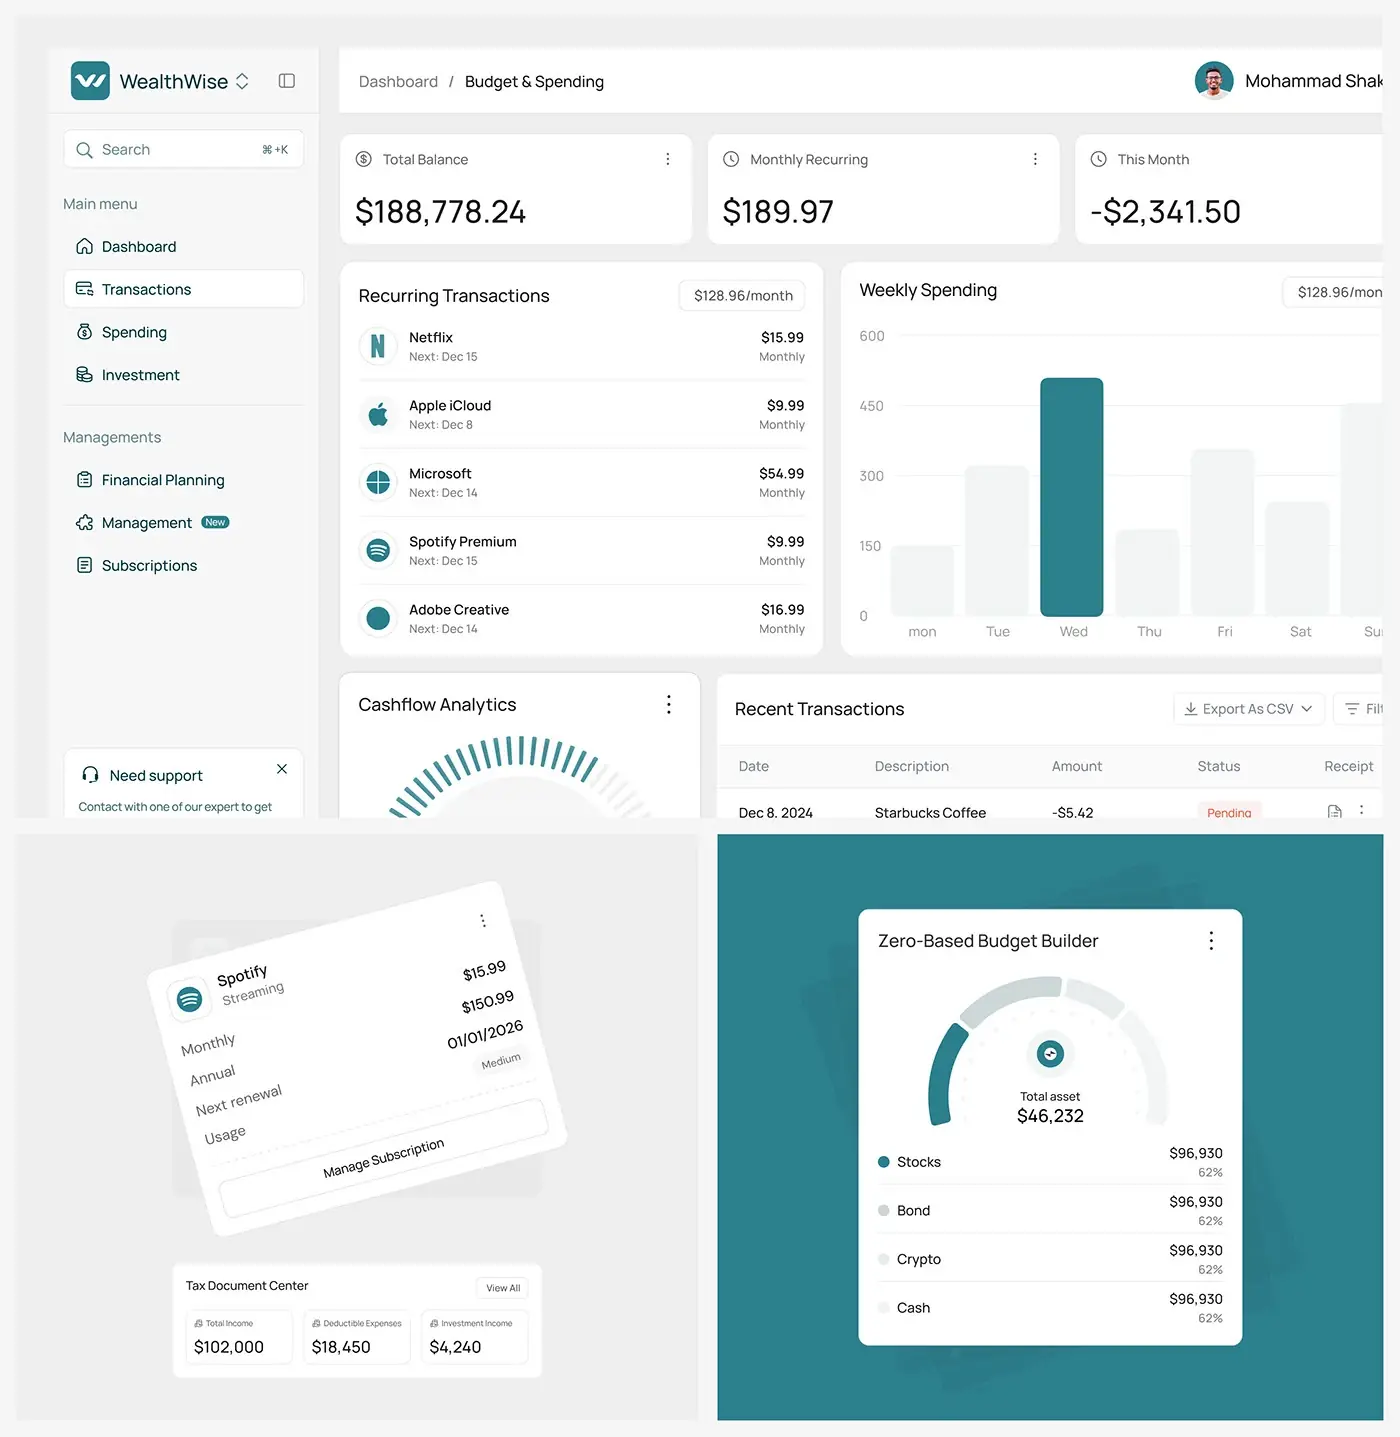
Total balance, monthly recurring and this month's spend sit at the top. Recurring payments list their next charge date beside a weekly spending chart, and recent transactions carry a status and receipt, with CSV export. Subscription cards show monthly and annual cost, next renewal and usage, each with a Manage Subscription button, so forgotten renewals surface on their own.
Investment
Investment performance plots value over time with a filter by asset type. A holdings table lists each company with shares and cost basis, and an allocation card splits total assets into stocks, bonds, crypto and cash. One page answers both "what do I own" and "how is it spread".
Goals, debt and tax
Savings goals such as an emergency fund and a child's education show progress bars and the monthly amount going in. A retirement calculator sets a retirement age and shows a 401(k) balance and retirement income sources. Debt payoff strategies such as Snowball list total interest, timeline and monthly payment, and a tax document centre totals income, deductible expenses and investment income.
Mobile home view
On a phone the home overview stacks into one column: net worth first, then expenses and incomes with their bar charts, then the AI financial health score. The order matches the desktop, so someone switching devices finds everything where they expect it.
The result
- The web dashboard, more than 40 screens: home, transactions, spending, investment, financial planning and subscriptions.
- A mobile layout of the home overview.
- A UI style guide and design system: type, colour, cards and charts.
How it helps the client
The design lets someone open one screen and see where their money went and what to change next, instead of checking several apps. Every AI insight sits next to the figure it explains, so people can see where it comes from. More of this work is in my fintech case studies. That's the thinking behind my product design for fintech dashboards.