




To improve INP in Next.js, measure before you change anything. Find the one slow interaction in field data from real users, see which of its three parts is long, reproduce it in Chrome DevTools with the CPU slowed down, and only then fix it. That is the order I follow in MVP development for startups in Next.js. A good INP is 200 milliseconds or less at the 75th percentile of page loads.
The fix follows the phase. Long input delay means too much JavaScript on the main thread, so ship less with Server Components, lazy loading and late third-party tags. Long processing means handlers and React renders do too much at once, so paint feedback first, yield, and use useTransition or useDeferredValue. Long presentation delay means too much to lay out and paint, so cut DOM size and stop forcing layout.
This guide is for founders, product leads and engineers who have seen "INP needs improvement" in a report and want a method.
What INP measures, and the thresholds that count
Interaction to Next Paint watches every click, tap and key press during a visit and reports the slowest, according to web.dev's INP article. Hover, scroll and zoom do not count, and on busy pages one of the highest is ignored for every 50 interactions. INP replaced First Input Delay as a Core Web Vital in March 2024, per the web.dev announcement.
Each interaction has three parts:
- Input delay: from the tap until your handler starts.
- Processing duration: your handlers, including the React render they trigger.
- Presentation delay: from the end of the handlers to the next frame.
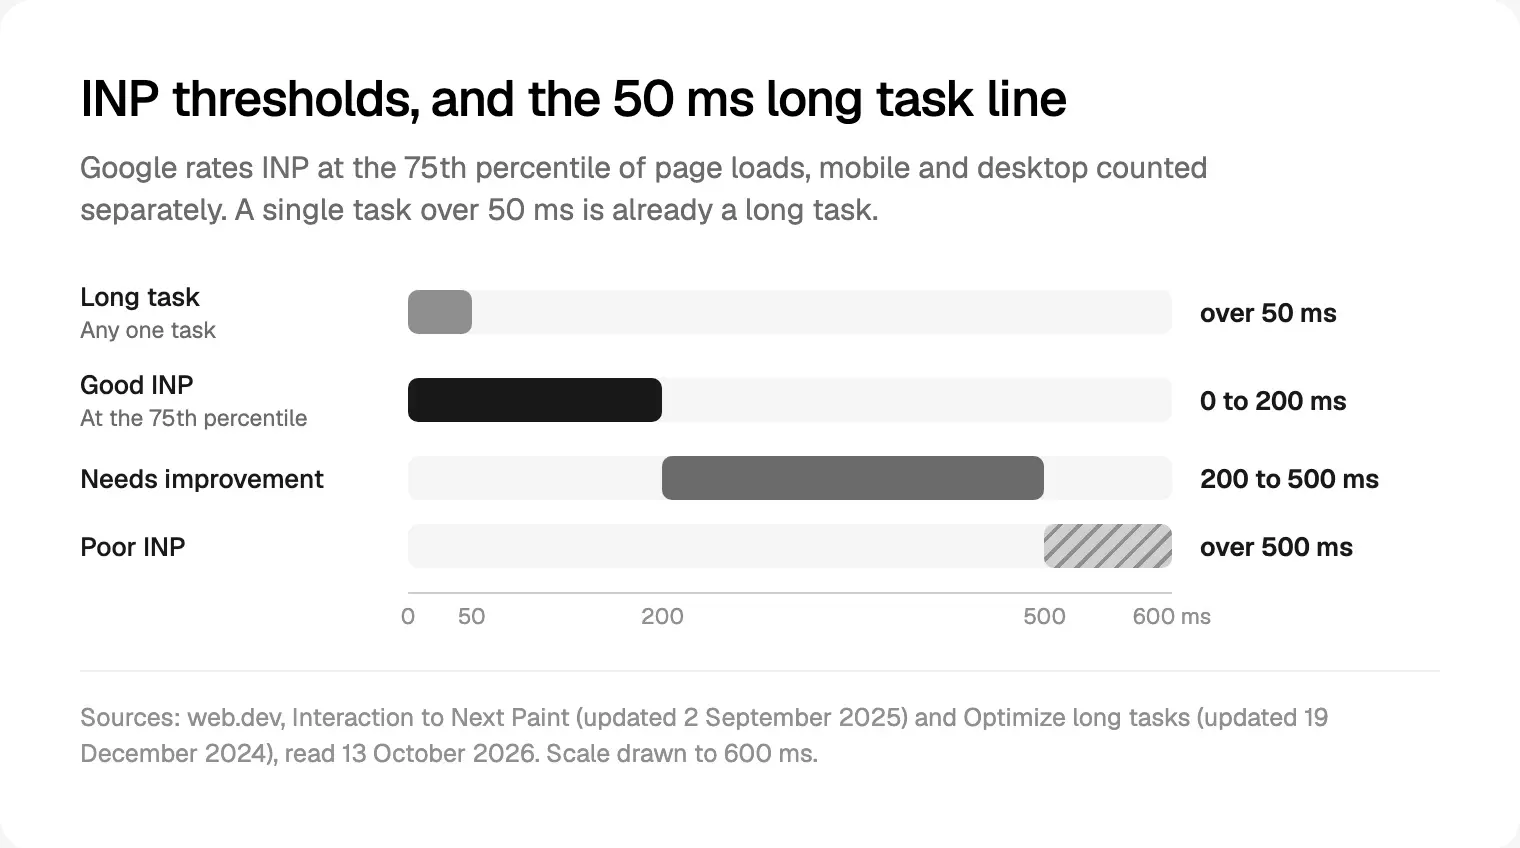
Good is 200 ms or less, needs improvement is up to 500 ms, poor is over 500 ms. Optimize INP sets that target at the 75th percentile of page loads, with mobile and desktop split. The number to beat is your slower quarter of visits.
Field data first: CrUX and PageSpeed Insights
I open PageSpeed Insights before any code. Its top section is field data from the Chrome UX Report: real Chrome users over the previous 28 days, at the 75th percentile, INP included. Its lower section is a Lighthouse lab run, whose metrics include Total Blocking Time but not INP, because nobody clicks during a simulated load. That is why a green Lighthouse score and a poor INP on the same page are not a contradiction.
CrUX has limits. The CrUX documentation says pages must be publicly discoverable and popular enough for a sound sample, so a new product or a logged-in dashboard may have no data at all. Even with data, Optimize INP notes that CrUX often lacks context: which element, which phase, which script. For that, you collect it yourself.
Collecting INP with attribution in a Next.js app
Next.js has a built-in hook, `useReportWebVitals`, that reports INP with a rating from a small Client Component in the root layout. It tells you whether INP is good, not why.
For the why, I add the attribution build of Google's `web-vitals` library, version 6.2.3 on npm when I checked. Its INP report names the element, the three phases, the load state and the longest overlapping script.
'use client'
import { useEffect } from 'react'
import { onINP } from 'web-vitals/attribution'

export function InpReporter() {
  useEffect(() => {
    onINP(({ value, attribution: a }) => {
      navigator.sendBeacon('/api/vitals', JSON.stringify({
        value, target: a.interactionTarget, load: a.loadState,
        input: a.inputDelay, processing: a.processingDuration,
        presentation: a.presentationDelay,
        script: a.longestScript?.entry.sourceURL,
      }))
    })
  }, [])
  return null
}
One fresh detail for App Router apps, which navigate on the client. Version 6 (21 July 2026, per its changelog) can report per soft navigation with reportSoftNavs, and Chrome for Developers says this measurement is on by default from Chrome 151, while CrUX reporting is "still to be determined". My reading: keep the classic report to compare with CrUX, and add soft navigation reports only if you want per-route numbers.
Group by target and load: if most slow taps happen while the page is loading, the problem is start-up, not the handler.
Finding the slow interaction: DevTools and long animation frames
With a suspect from the field, I reproduce it locally. The Chrome DevTools Performance panel shows live local INP, an Interactions list with each one's phases and, with field data connected, suggested test conditions such as a 20x CPU slowdown. I also test on a mid-range Android phone; a fast laptop hides INP problems.
Record a trace while repeating the interaction: a long block before the event is input delay, a long event block is processing, and long style, layout and paint after it is presentation delay.
In the field, the Long Animation Frames API turns "slow" into a file name. It reports frames delayed beyond 50 ms, with each script over 5 ms, its sourceURL, what invoked it, and time spent on forced layout. It shipped in Chrome 123; Firefox and Safari don't support it, so this attribution only comes from Chromium browsers. The attribution build above already attaches these frames to each INP report.
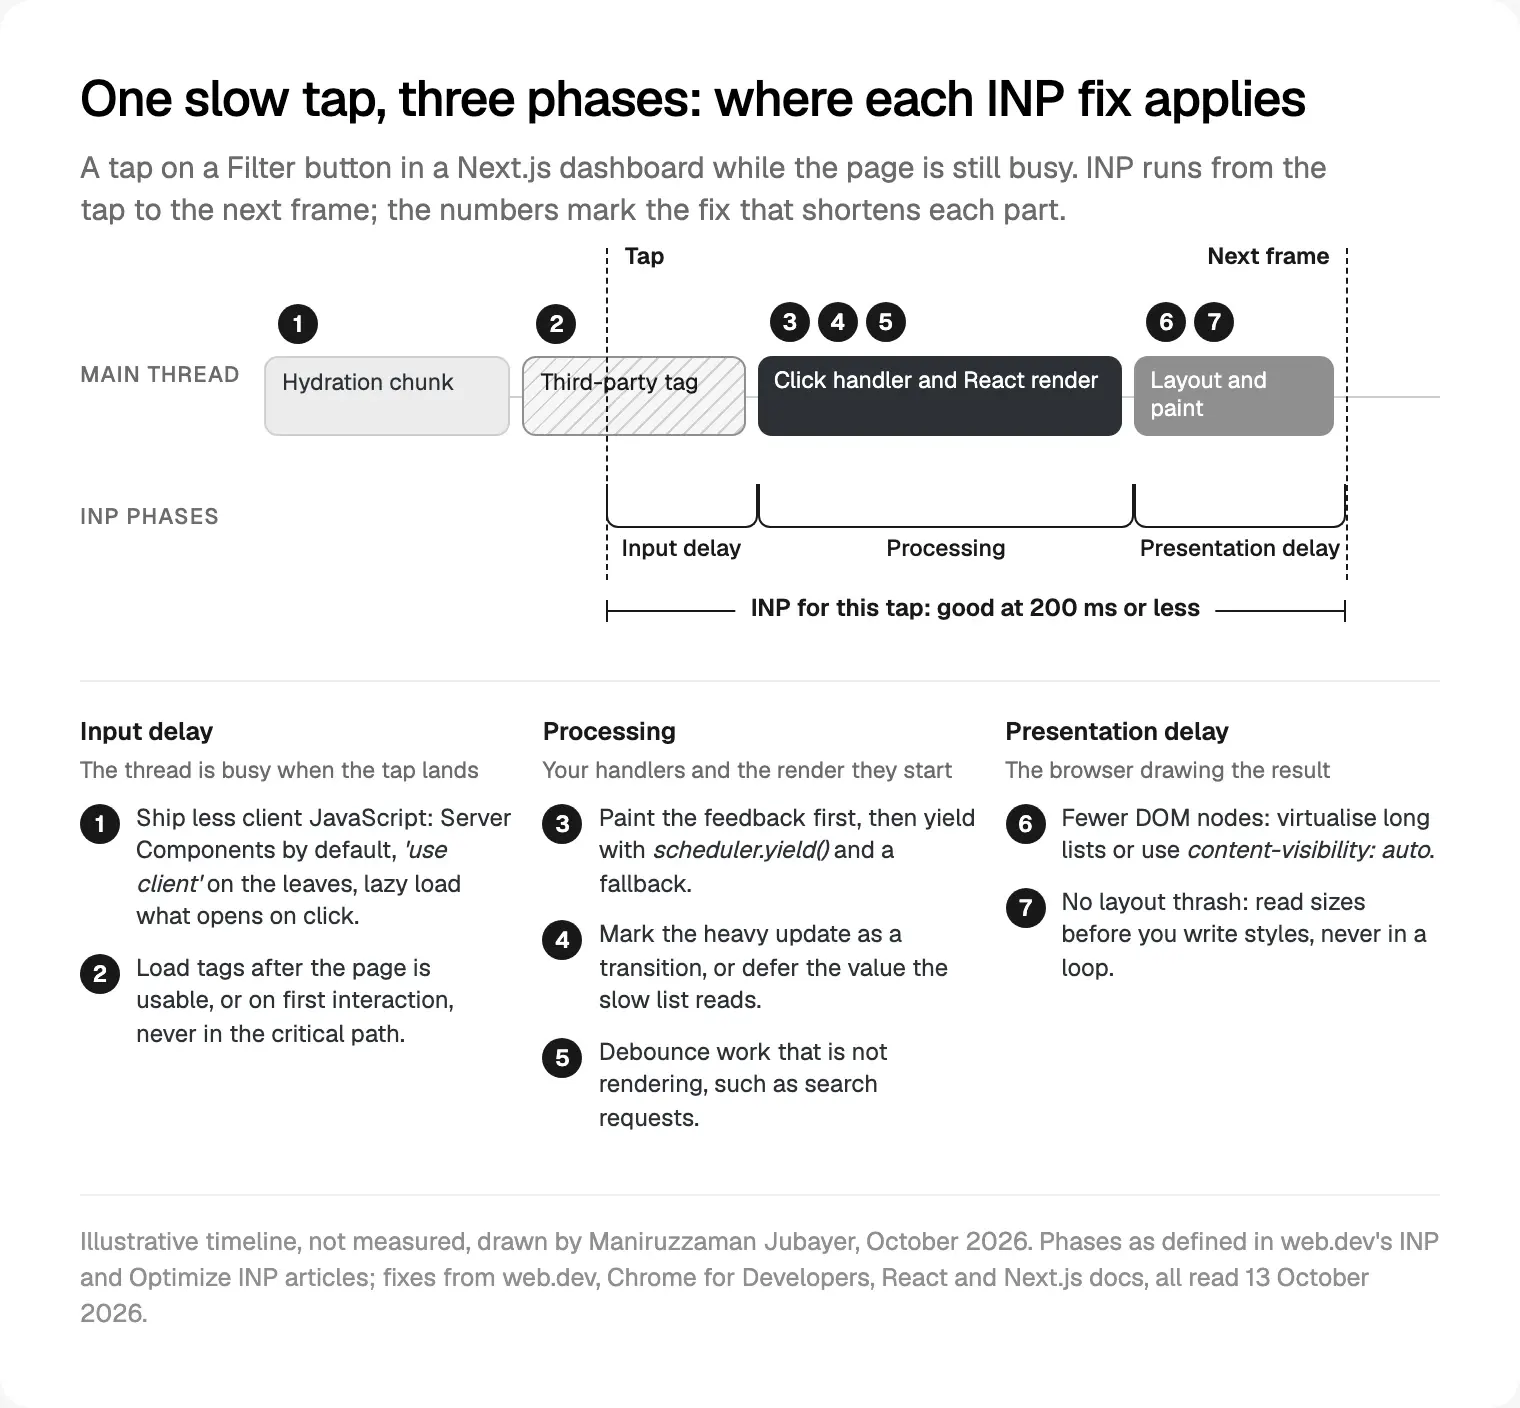
The order I fix INP in
Once I know the phase, I work through the fixes numbered in the timeline, cheapest and widest first.
| Long phase | What it usually is in a Next.js app | Where I look first |
|---|---|---|
| Input delay | Hydration, big client bundles, tags evaluating | 'use client' placement, next/script strategy |
| Processing | One handler doing everything, a big re-render | The handler, the component that re-renders, memo |
| Presentation delay | Thousands of rows, forced layout, client-rendered HTML | DOM size, layout reads in loops |
Less JavaScript on the main thread: Server Components and lazy loading
Pages and layouts are Server Components by default. The Next.js guide to Server and Client Components is precise: once a file has 'use client', its imports and the components it renders go into the client bundle, and hydrating them competes with the person trying to tap.
So I check where 'use client' sits. A layout marked as a Client Component for one search box ships the whole navigation. Move the directive down to the search box, and pass server-rendered content into client wrappers as children, which stays out of the client module graph. My post on taking a Figma design into Next.js shows how I draw that boundary; here it is an INP decision too.
Then lazy load what nobody has asked for yet. The Next.js lazy loading guide uses next/dynamic to keep Client Components and libraries out of the bundle until needed, such as a modal opened on click. In dashboards: date pickers, rich text editors, charts and export tools.
Transitions and optimistic UI help too, but they don't replace shipping less JavaScript. My layer-by-layer SaaS tech stack explains why I default to Next.js; this is the part of that choice you keep earning.
Third-party scripts: load them after the page is usable
Analytics, pixels, chat widgets and session recorders all run on your main thread. The `next/script` reference gives afterInteractive (the default, after some hydration, with tag managers and analytics as examples), lazyOnload (browser idle time, for chat and social widgets) and worker, which it marks experimental and says does not yet work with the App Router.
On this site I go further: the tag queues exist at once, so no event is lost, but the scripts load on the visitor's first scroll, tap, key press or pointer move, or after 5 seconds.
The trade-off: a tag that loads on the first interaction may evaluate during the second. For a content site I accept that. For a dashboard full of early clicks, I would use lazyOnload, fewer tags, and check longestScript before blaming one.
Breaking up long handlers: yield, transitions and deferred values
Any task over 50 ms is a long task, per web.dev's guide to long tasks, and the browser can't paint in the middle of one. So split the work: do what the person needs to see, yield, then do the rest. scheduler.yield() resumes your function in a new task that goes ahead of other queued work, where a setTimeout callback goes to the back. The same guide gives a fallback:
function yieldToMain() {
  if (globalThis.scheduler?.yield) return scheduler.yield()
  return new Promise((resolve) => setTimeout(resolve, 0))
}

async function onApplyFilter(next) {
  showFilterChip(next)   // feedback first
  await yieldToMain()    // let the browser paint it
  recalculateTotals(next)
}
Check support before relying on these APIs:
| API | Chrome and Edge | Firefox | Safari | If it is missing |
|---|---|---|---|---|
scheduler.yield() | 129 | 142 | No | setTimeout fallback, without the priority |
| Long Animation Frames | 123 | No | No | Field attribution from Chromium only |
content-visibility | 85 | 125 | 18 | Baseline since 15 September 2025 |
Versions are from MDN's compatibility data on 13 October 2026; MDN marks `scheduler.yield()` as limited availability.
In React, say which update can wait. `useTransition` marks an update as a non-blocking Transition: if the person clicks another tab mid-render, React drops that work for the new click, and isPending shows progress. The docs are firm on one limit: "Transition updates can't be used to control text inputs."
For a text box that filters a slow list, `useDeferredValue` fits. The input updates at once; the list renders with the deferred value in the background and restarts if typing continues.
const deferredQuery = useDeferredValue(query)
// DoctorTable is wrapped in memo
<input value={query} onChange={(e) => setQuery(e.target.value)} />
<DoctorTable query={deferredQuery} />
The memo is not optional: without it, the slow component re-renders on the urgent pass and the deferral does nothing.
Debouncing input and virtualising long lists
Debouncing waits until input stops for a set time before acting. The React docs contrast it with a deferred value: a fixed delay that can't be interrupted, so I keep it for work that is not rendering, such as a search request: defer the render, debounce the fetch.
For long tables, presentation delay often comes from DOM size. Virtualisation renders only the rows in view; web.dev's article on virtualising lists explains it with react-window and warns that infinite loading can rebuild the huge DOM you avoided.
I don't virtualise by default. Rows not rendered can't be found with find-in-page and need care so keyboard and screen reader users know how many exist; that is my reading from building tables. For a few hundred rows I try `content-visibility: auto` first: the browser skips layout and paint off screen, contain-intrinsic-size: auto keeps the scrollbar steady, and the DOM stays whole.
CSS and layout work that delays the next paint
A forced synchronous layout happens when code changes a style and then reads a value such as offsetHeight in the same task; in a loop, that is layout thrashing, one layout per item. Setting each row's width from box.offsetWidth inside the loop is the classic case. web.dev's article on layout thrashing gives the fix, read first and write after, and notes the DevTools Forced Reflow insight.
Two more causes I check. Rendering a big block of HTML on the client after a click blocks the frame until it is done, while streamed server HTML is parsed in pieces, as Optimize INP points out. And animated page changes need a light DOM update, because the next frame waits for it; my guide to page transitions with the View Transitions API covers that side.
A dense screen from my work, and where INP would bite
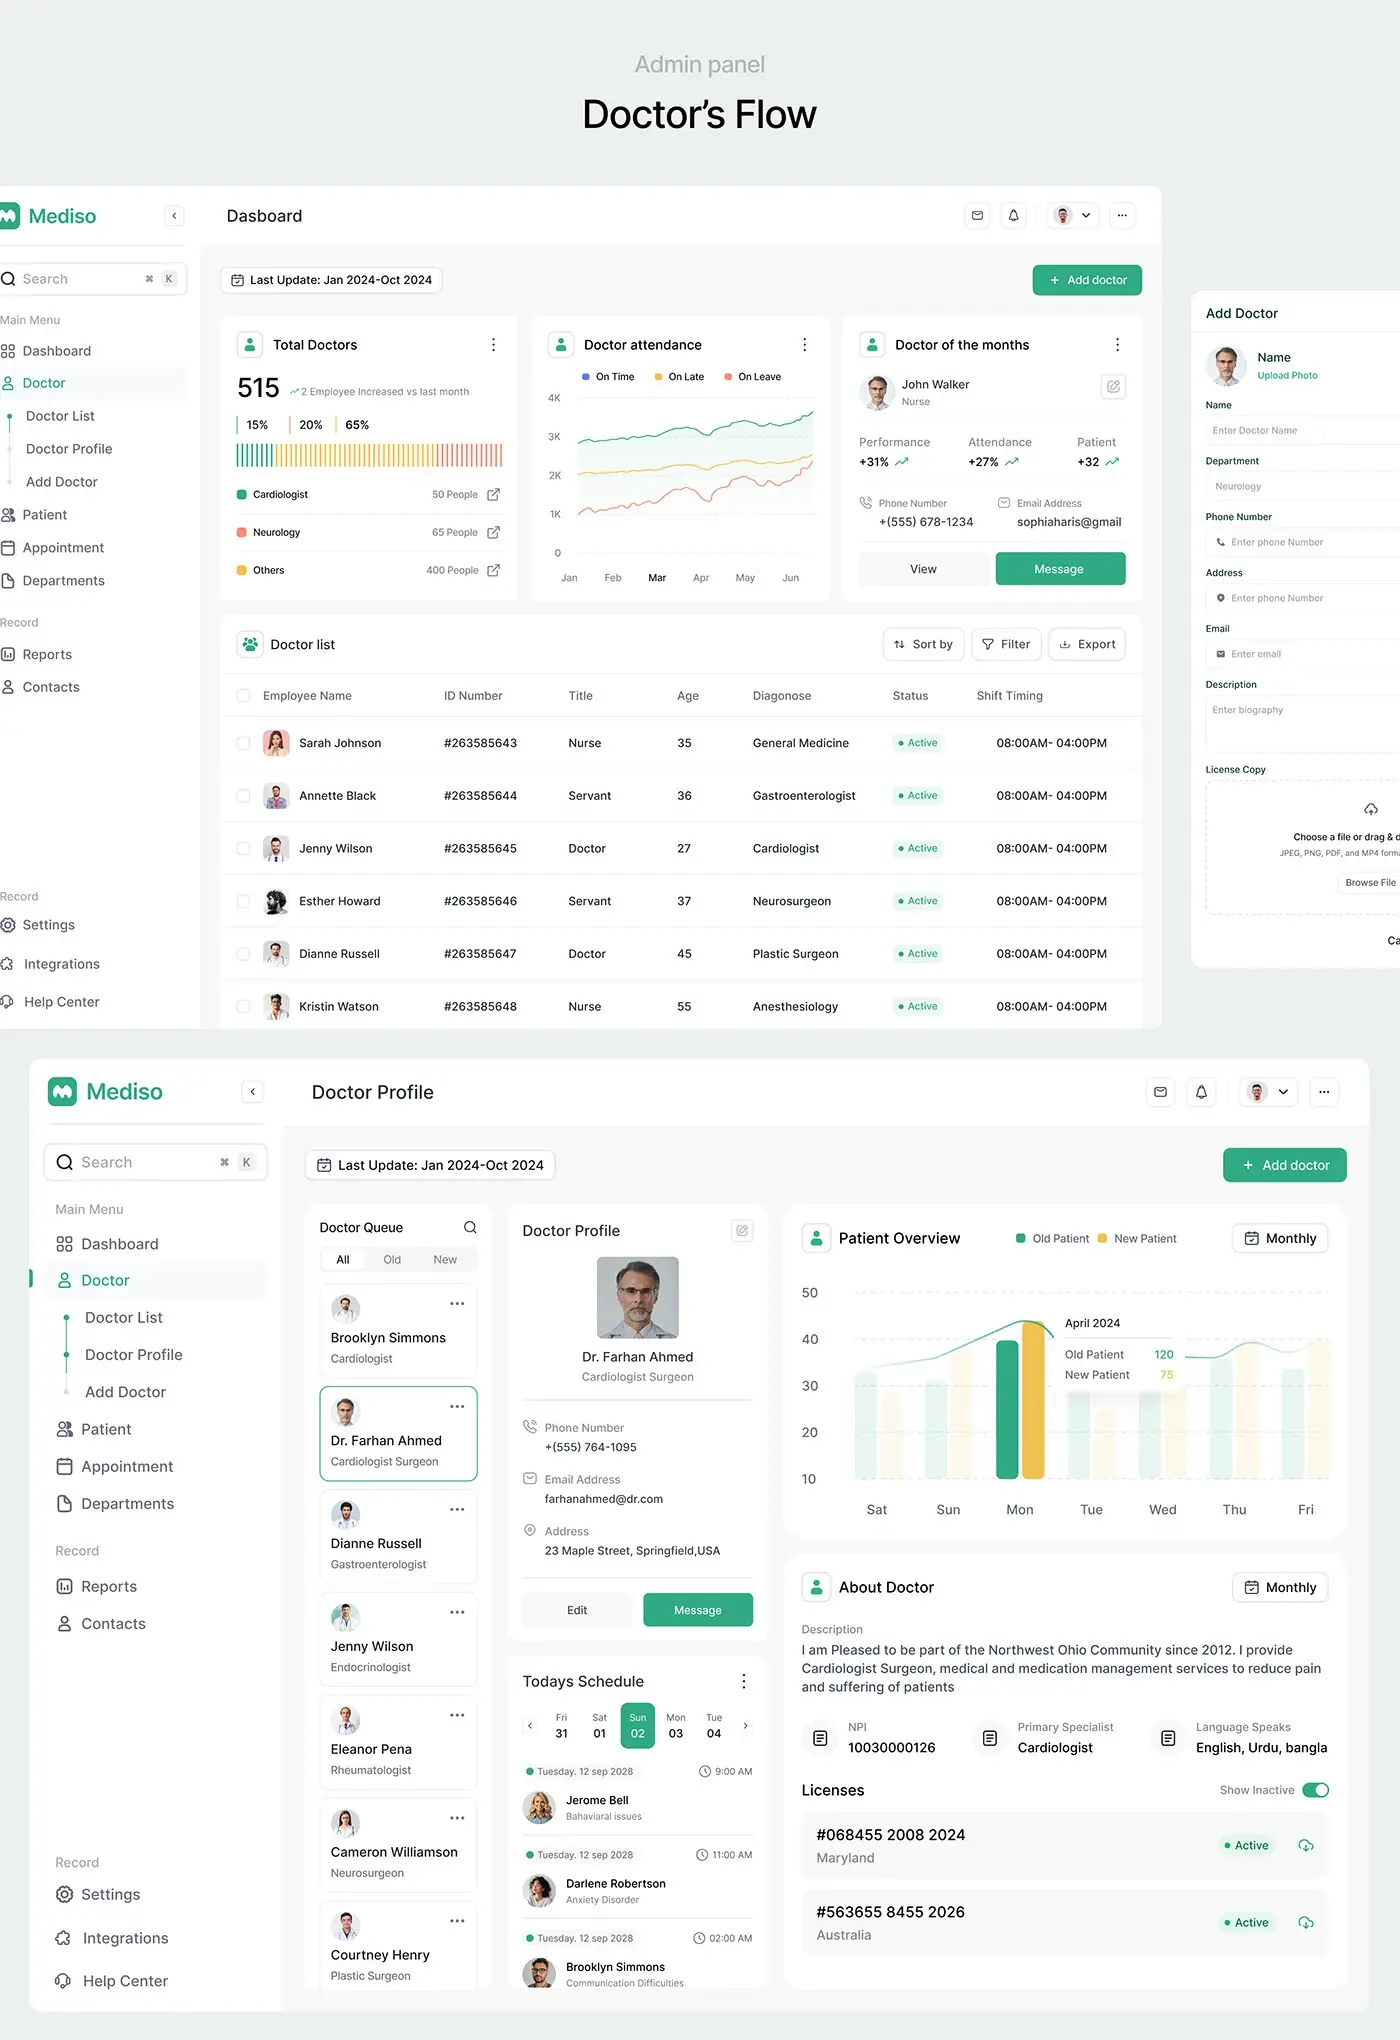
Mediso is the kind of product where INP problems live: a doctor table with sort, filter and export under attendance charts, a profile view with a scrolling queue and schedule strip, and an add-doctor form panel with a file upload. None of it is slow in Figma. All of it can be slow in a browser.
When I plan a build like this, I go control by control and ask what each one triggers. Sorting re-renders every row, so rows are memoised and the sort runs as a transition. The search box drives a deferred value, and its request is debounced. Export waits for a yield, or moves to a worker if the file is large. The add-doctor panel and the chart library are lazy loaded. Anything that only shows data stays a Server Component. That list goes into the written scope, so performance is planned and quoted with the screens; it is how I scope Next.js builds for SaaS teams.
Where I would start
If your INP is poor and you don't know why, spend the first day on measurement: PageSpeed Insights for the field number, the web-vitals attribution build behind a beacon, then a week of real data to name the element and phase. In a Next.js codebase, the first places I look are a 'use client' sitting too high and heavy components loaded before anyone opens them; next comes a handler that does everything before painting anything.
I would not micro-tune a component because it looks heavy in code; INP is about the taps people actually make, on the phones they own.
If you want one person who designs the screen and keeps it fast in code, read how I work, then see my Next.js development work for founders. It starts with a free 30 minute intro call, then a written scope and one fixed quote, with performance targets in that scope from day one.
Frequently asked questions
What is a good INP score?
A good INP is 200 milliseconds or less at the 75th percentile of page loads, with mobile and desktop assessed separately. From 200 to 500 milliseconds needs improvement, and over 500 is poor, per Google's web.dev articles. Your slower phones decide the score, not your laptop.
Why does Lighthouse not show INP?
INP needs a real person interacting, and Lighthouse runs a simulated load with nobody clicking. PageSpeed Insights shows INP only in its field data, from real Chrome users over the previous 28 days. Total Blocking Time in the lab hints at main-thread pressure, but it is not INP.
How do I measure INP in a Next.js app?
Use the built-in useReportWebVitals hook in a small Client Component in your root layout to send INP to your analytics. For the cause, add the attribution build of Google's web-vitals library, which reports the element, the load state and the three phases. Then reproduce the slowest interaction in the Chrome DevTools Performance panel with the CPU throttled.
Do React Server Components improve INP?
They can, mostly by cutting input delay. Server Components send rendered output rather than component code, so less JavaScript has to download, evaluate and hydrate before the page responds. The gain depends on where 'use client' sits, and they do nothing for a slow click handler.
Does useTransition improve INP?
It helps when the slow part is a React re-render after the interaction. Marking that update as a Transition lets React paint the urgent update first and interrupt the heavy render if the person clicks again. It doesn't make the render faster, can't control a text input, and doesn't help a handler that blocks before it reaches React.
Is scheduler.yield supported in Safari?
Not as of 13 October 2026. MDN's compatibility data lists scheduler.yield() in Chrome and Edge 129 and Firefox 142, with no Safari support, and MDN marks it as limited availability. Feature-detect it and fall back to a setTimeout promise, which still yields without the priority.
Do third-party scripts hurt INP?
Often. Analytics, pixels and chat widgets share the main thread with your app, so a tag evaluating while someone taps adds input delay. Load them with next/script using afterInteractive or lazyOnload, or on first interaction, and check the longest script in your INP attribution data to confirm which tag is involved before you remove anything.
Sources and method
I read every source on 13 October 2026; "updated" dates are the pages' own. Versions come from npm and MDN's compatibility data that day. The timeline is illustrative, not measured; I give no before and after numbers from my projects, and did not test soft navigation reporting myself.
- web.dev, INP (updated 2 September 2025), Optimize INP (updated 2 September 2025), INP as a Core Web Vital (updated 12 March 2024), date read 13 October 2026: web.dev, web.dev, web.dev
- web.dev, Optimize long tasks (updated 19 December 2024), virtualising lists, layout thrashing (updated 7 May 2025), content-visibility (updated 23 September 2025), date read 13 October 2026: web.dev, web.dev, web.dev, web.dev
- Google, About PageSpeed Insights (updated 21 October 2024), date read 13 October 2026: developers.google.com
- Chrome for Developers, CrUX overview, Performance panel (updated 17 September 2024), Long Animation Frames (updated 14 October 2024), soft navigations (updated 2 September 2026), date read 13 October 2026: developer.chrome.com, developer.chrome.com, developer.chrome.com, developer.chrome.com
- Google Chrome, web-vitals README and changelog (v6.2.3, 5 October 2026), date read 13 October 2026: github.com
- MDN,
Scheduler.yield()and browser compatibility data, date read 13 October 2026: developer.mozilla.org - React docs,
useTransitionanduseDeferredValue, date read 13 October 2026: react.dev, react.dev - Next.js docs (16.4.0, updated 5 October 2026),
useReportWebVitals, Server and Client Components, lazy loading, Script, date read 13 October 2026: nextjs.org, nextjs.org, nextjs.org, nextjs.org
Tags: Next.js, React, Core Web Vitals, INP, Performance