

Overview
This hospital management dashboard design case study covers Mediso, a web platform for hospital admin teams. It brings patients, doctors, appointments and departments into one place. I designed the web dashboard, from research to final UI, between 10 April and 29 May.
The challenge
Hospital admins work under time pressure, so every part of the hospital had to be readable at a glance.
- Billing, arrivals, surgeries and urgent reports need to sit on one screen.
- Doctor attendance, shifts and schedules have to be visible before a gap opens.
- A patient's vitals, ward, diagnosis and reports belong on one profile.
- 16 departments and a full week of appointments must stay easy to scan.
The process
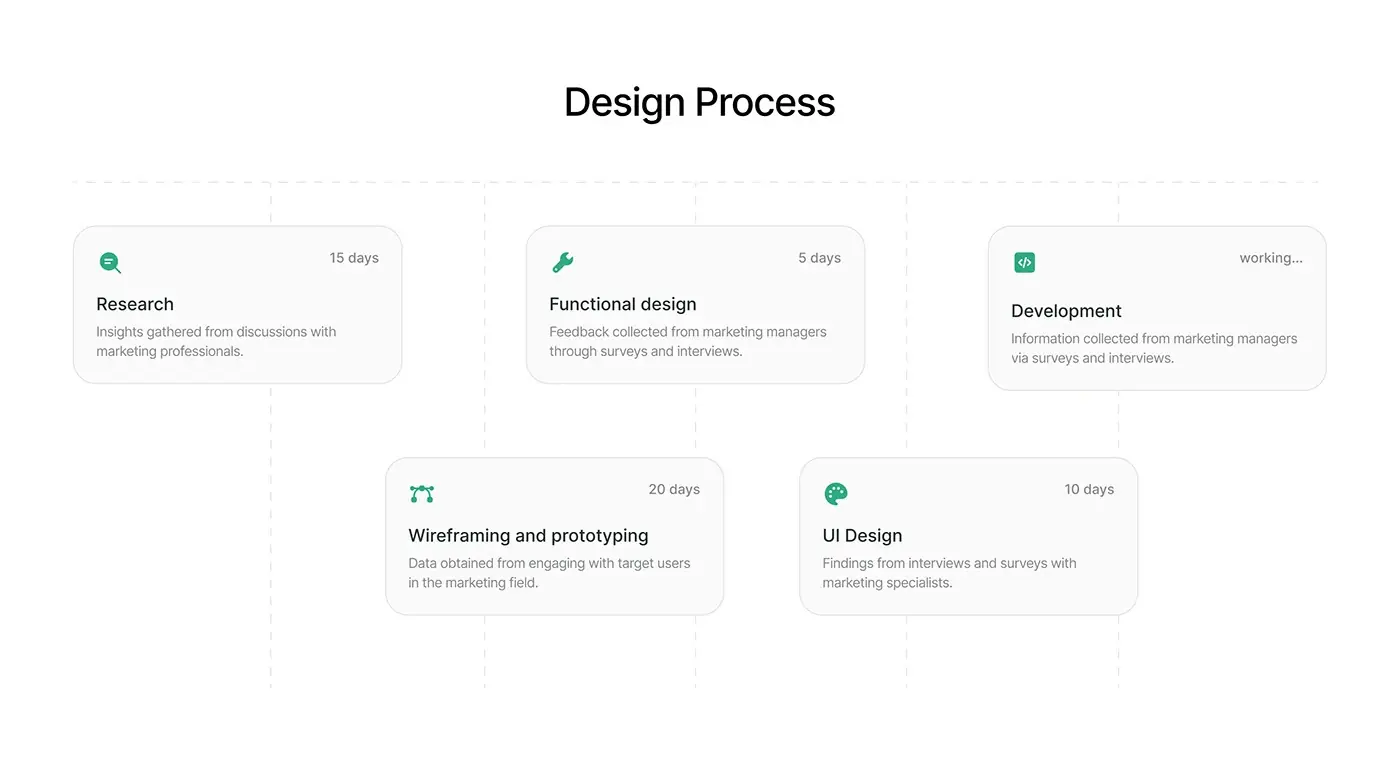
- Research: 15 days.
- Functional design: 5 days.
- Wireframing and prototyping: 20 days.
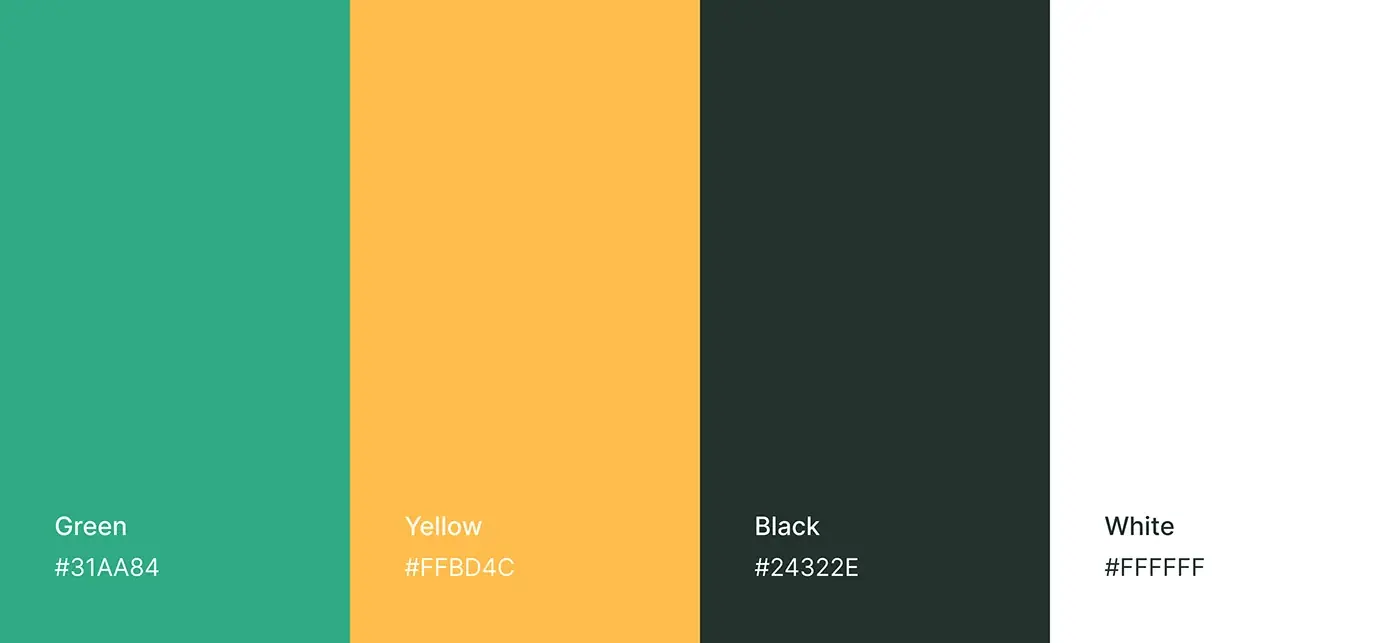
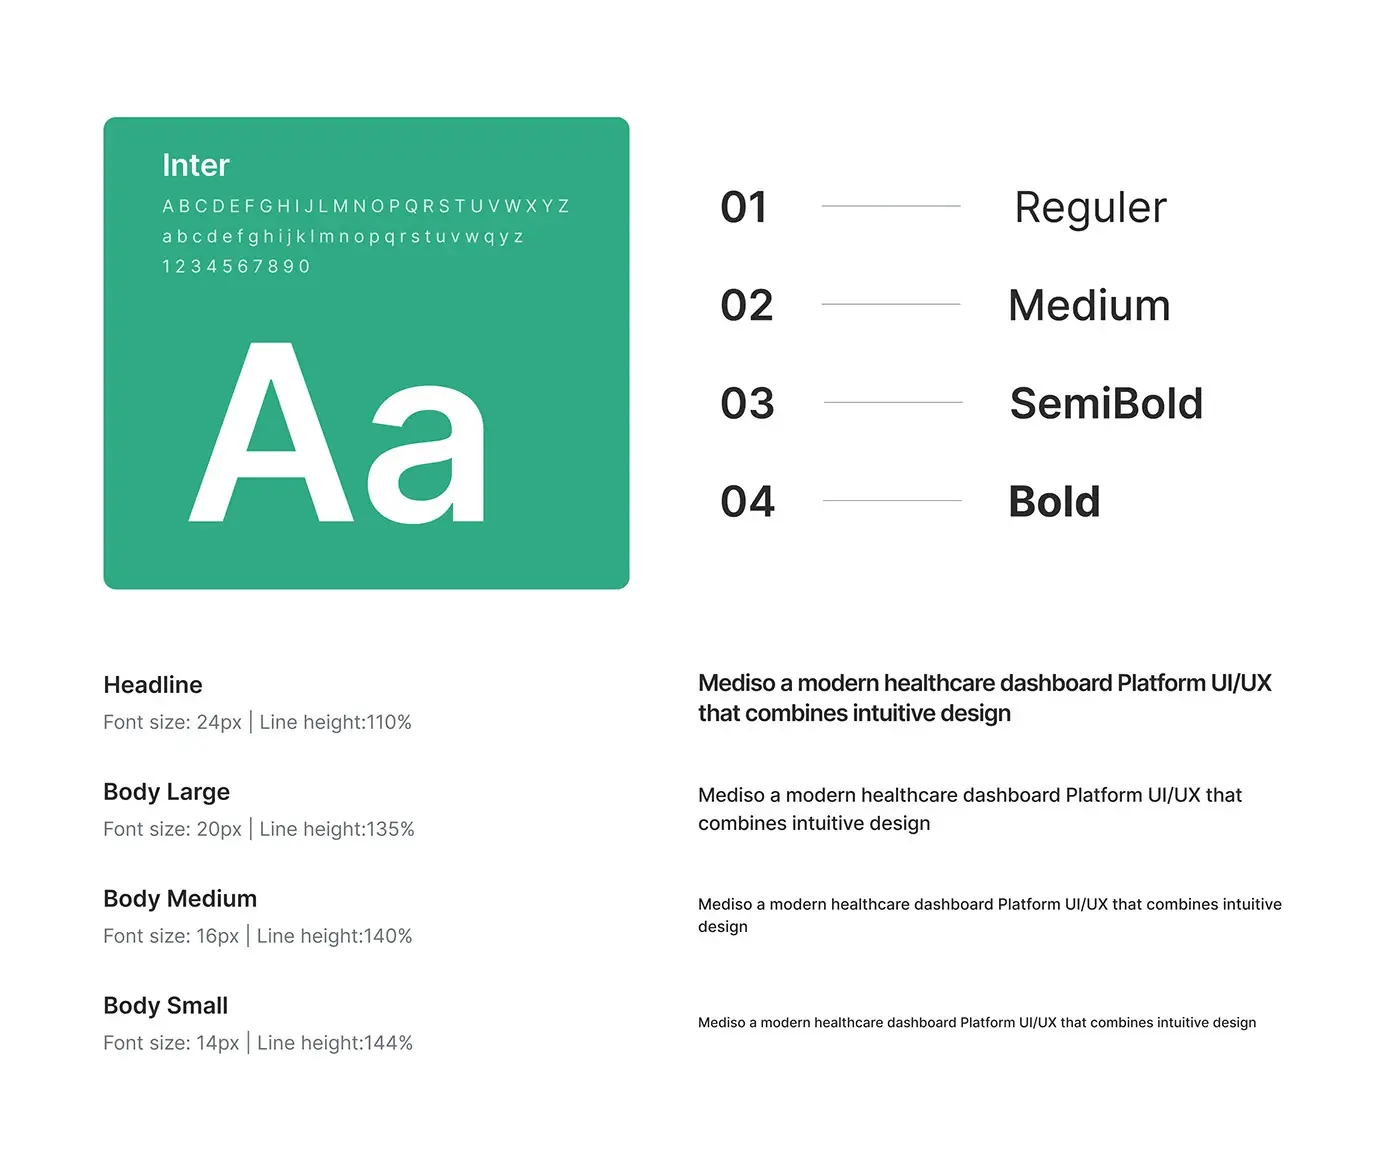
- UI design: 10 days, with a style guide in Inter and a green, yellow and near black palette.
In the palette, green marks actions and positive numbers, yellow the second data series, and near black the text.
The solution
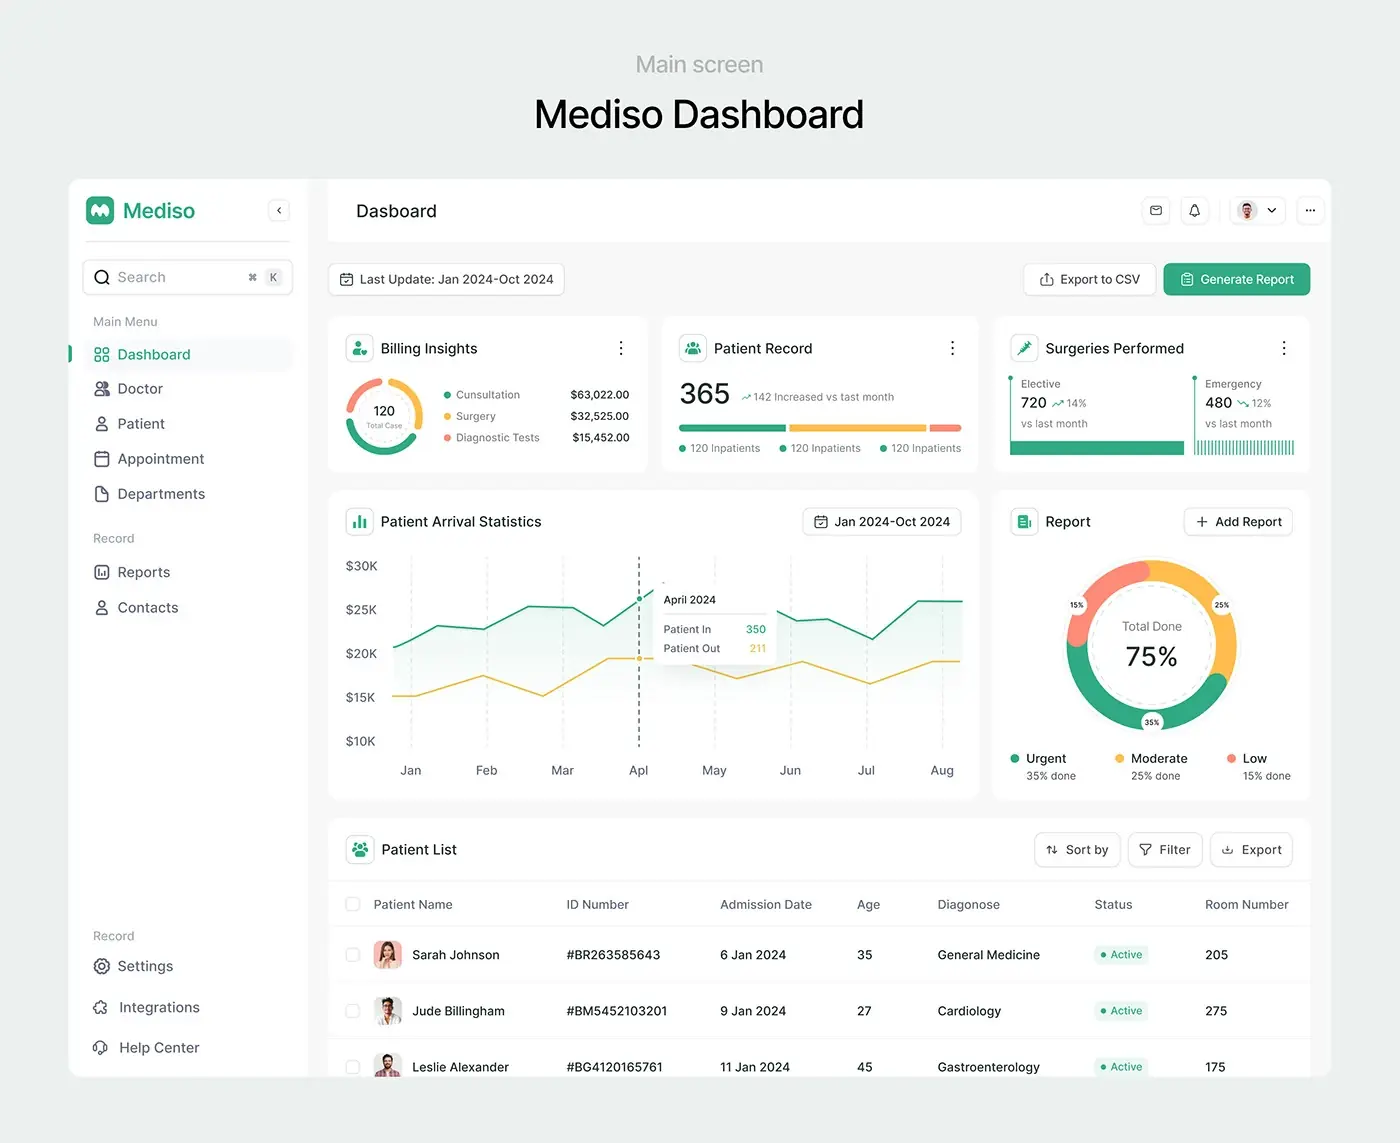
Every screen follows one pattern: key numbers in cards on top, the working list underneath. The sidebar never changes.
Main dashboard
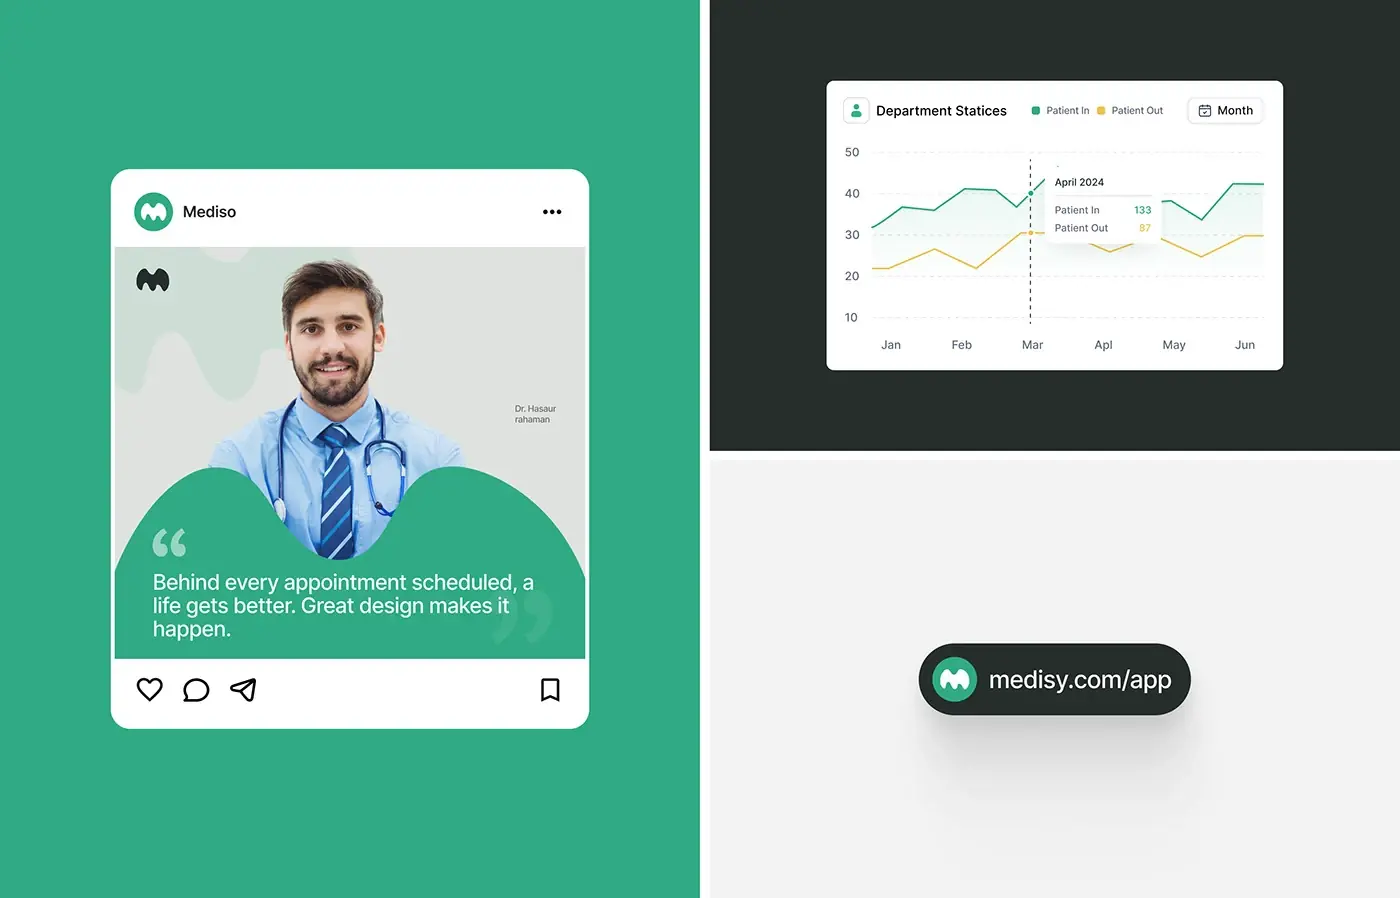
Under a date range, Export to CSV and Generate Report, five cards follow: billing insights split into consultation, surgery and diagnostic tests; patient records against last month; elective and emergency surgeries; a patient arrival chart of patients in and out by month; and a report ring by urgency. The patient list underneath adds sort, filter and export.
Doctor list and attendance
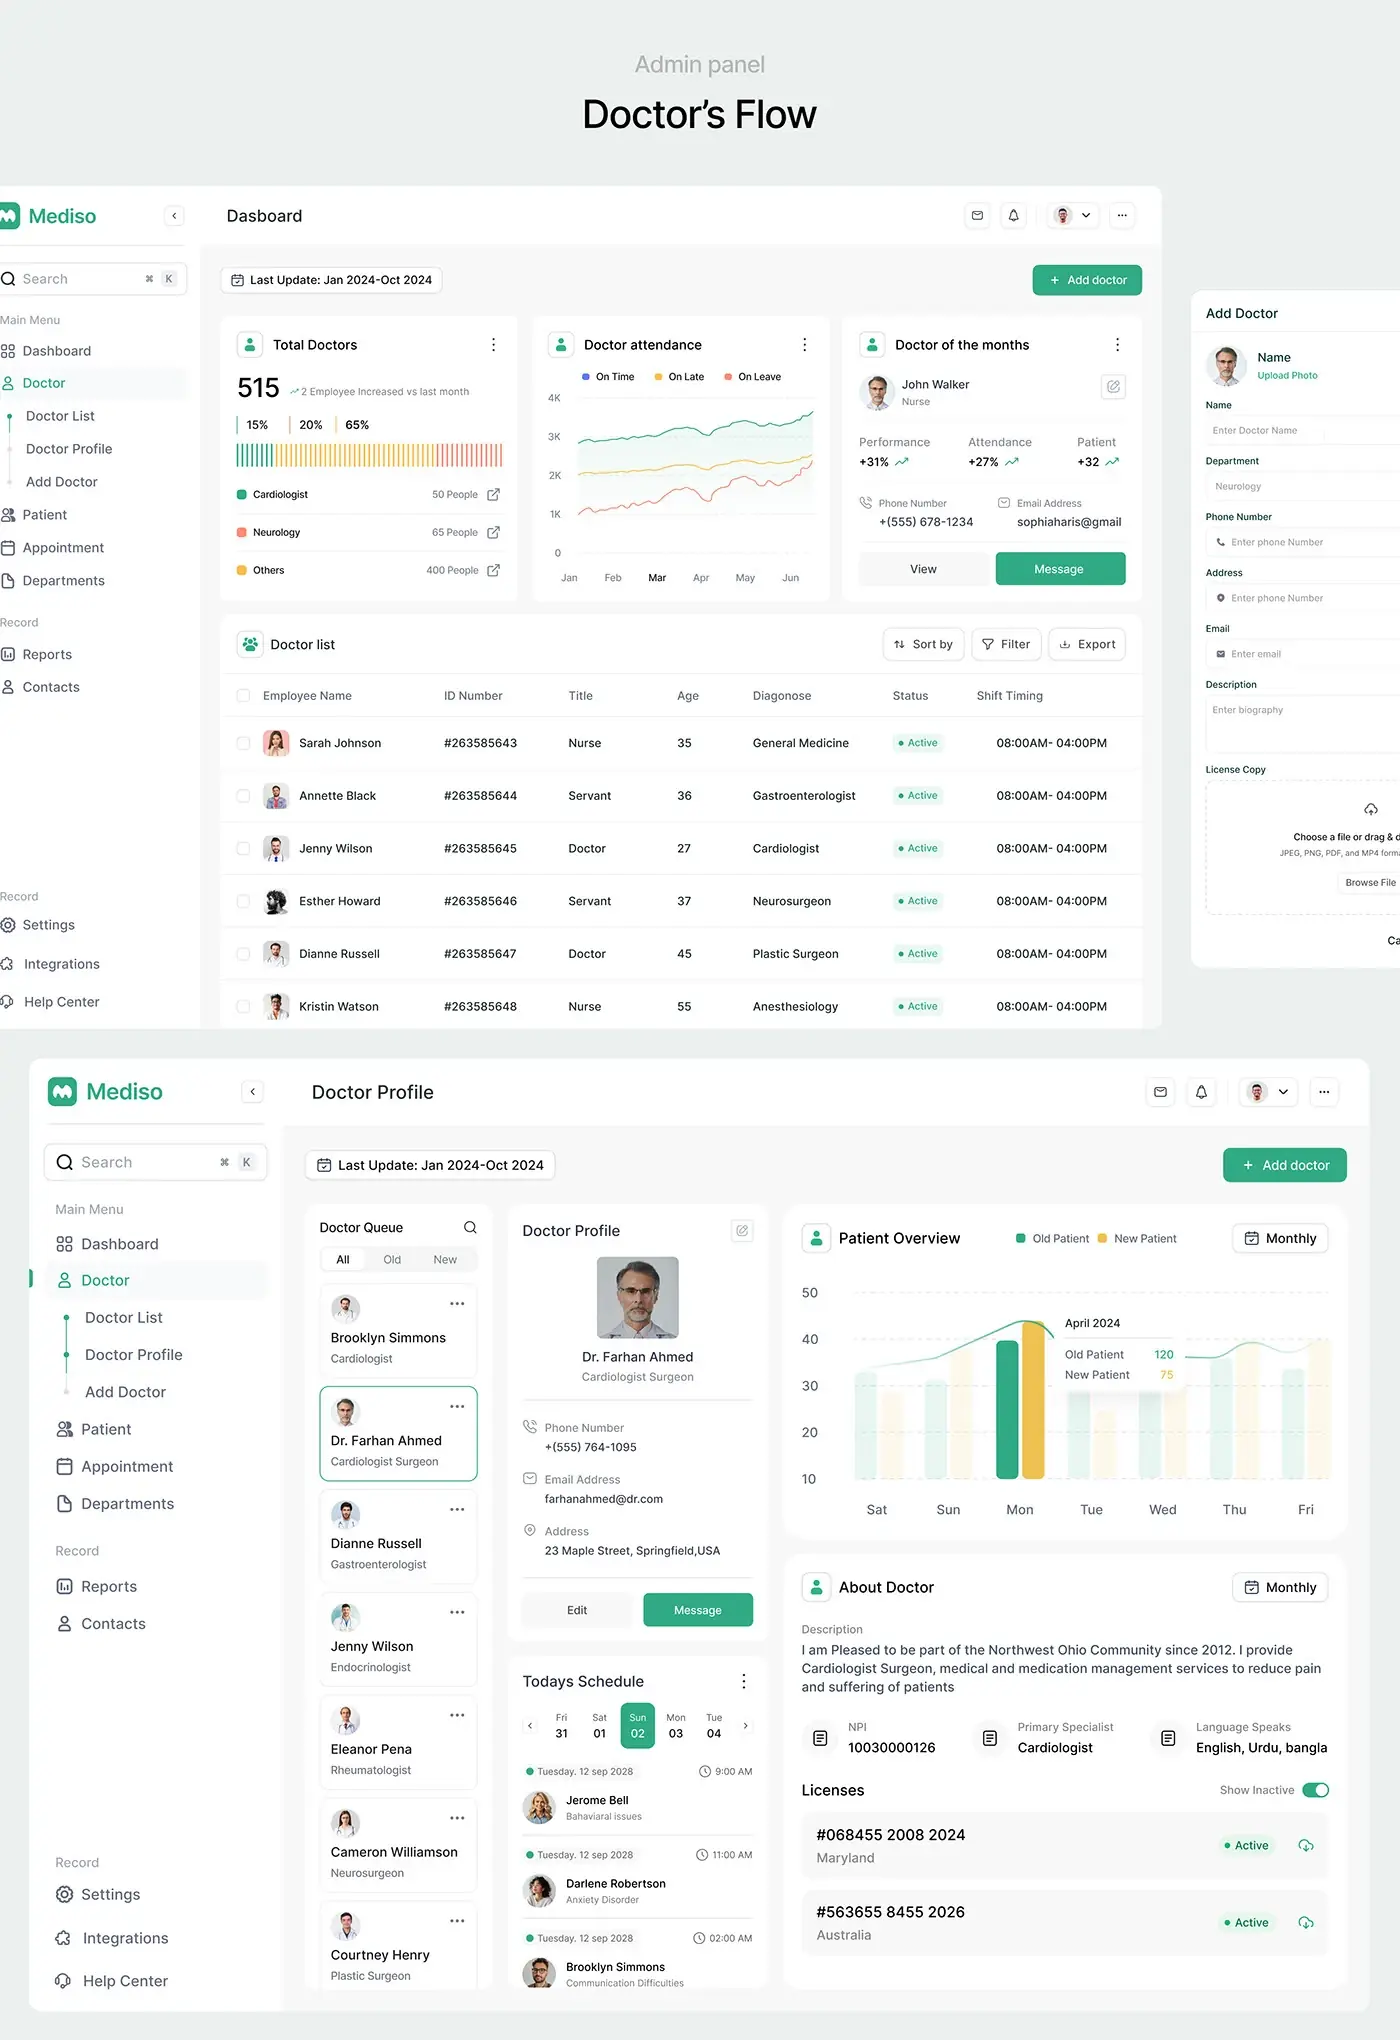
The doctor screen counts total doctors by speciality, charts attendance as on time, late and on leave, and features a doctor of the month with performance and attendance figures. The list shows each doctor's title, speciality, status and shift. Add Doctor opens as a side panel, so the list stays in view, and takes contact details and an upload of the licence copy.
Doctor profile
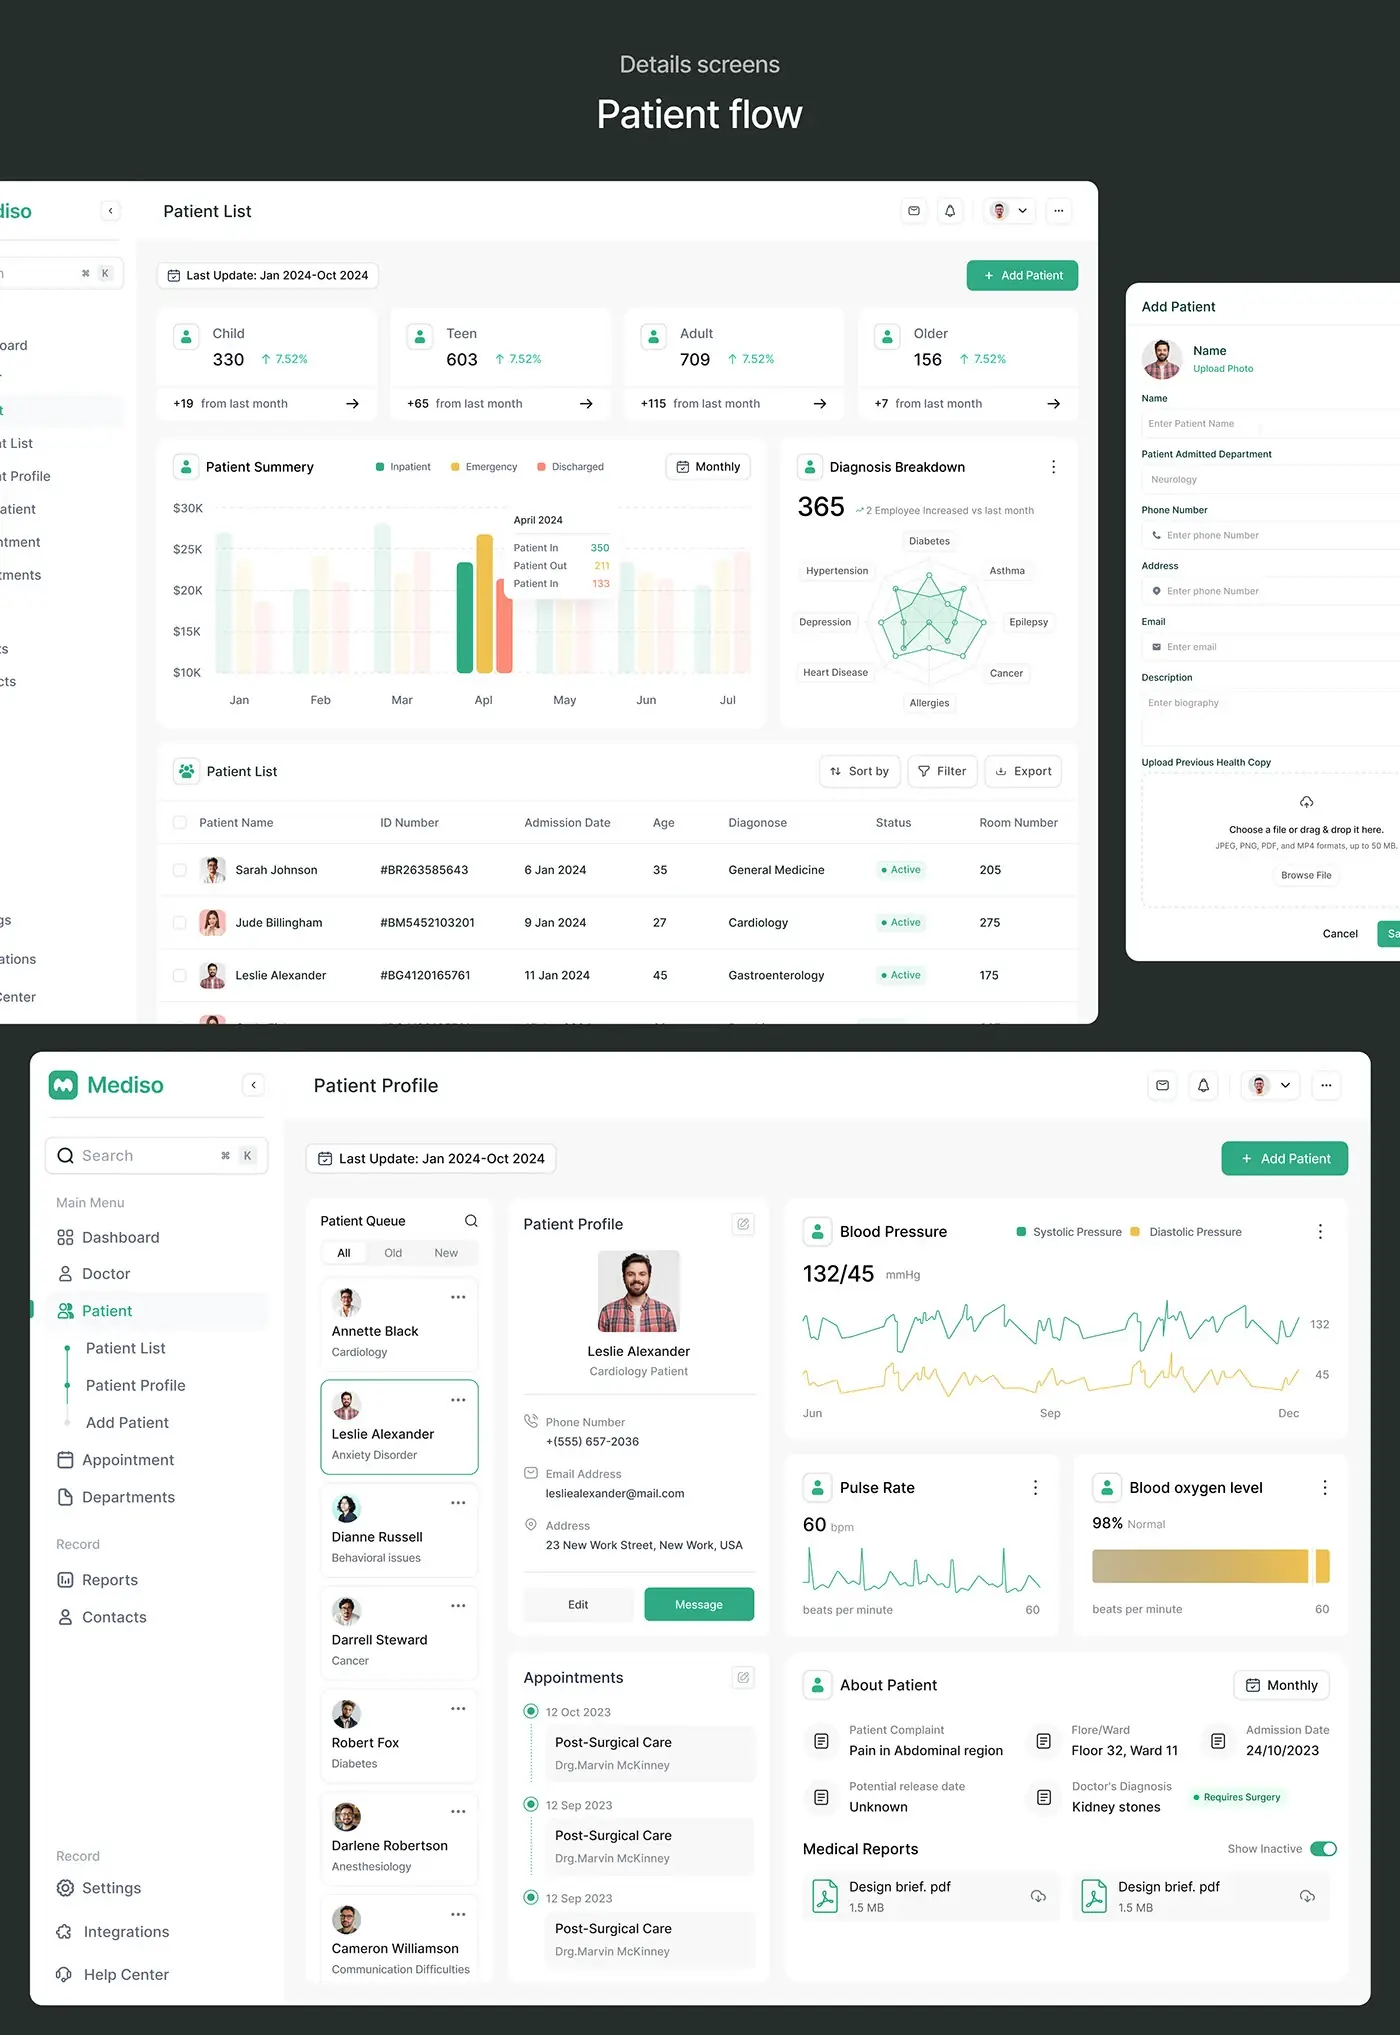
A doctor queue on the left, filtered by all, old and new, lets an admin move between doctors without going back to the list. The profile shows contact details with Edit and Message, today's schedule on a date strip, and a chart of old and new patients by day. Below sit the NPI number, speciality, languages and each licence with its region and status.
Patient list
Four cards split patients into child, teen, adult and older, each with its change from last month. A patient summary chart compares inpatient, emergency and discharged numbers, and a diagnosis breakdown plots eight conditions, from diabetes and asthma to heart disease and cancer, on one radar chart. Add Patient mirrors the doctor panel and adds the admitting department and an upload for previous health records.
Patient profile
The profile reuses the doctor screens' queue and card, so staff already know where to look. Vitals take the top right: a blood pressure chart, pulse rate and blood oxygen. Beside the appointment timeline, an About Patient panel lists the complaint, floor and ward, admission date, expected release date and the doctor's diagnosis, flagged when surgery is needed. Medical reports sit at the bottom as downloads.
Appointment calendar
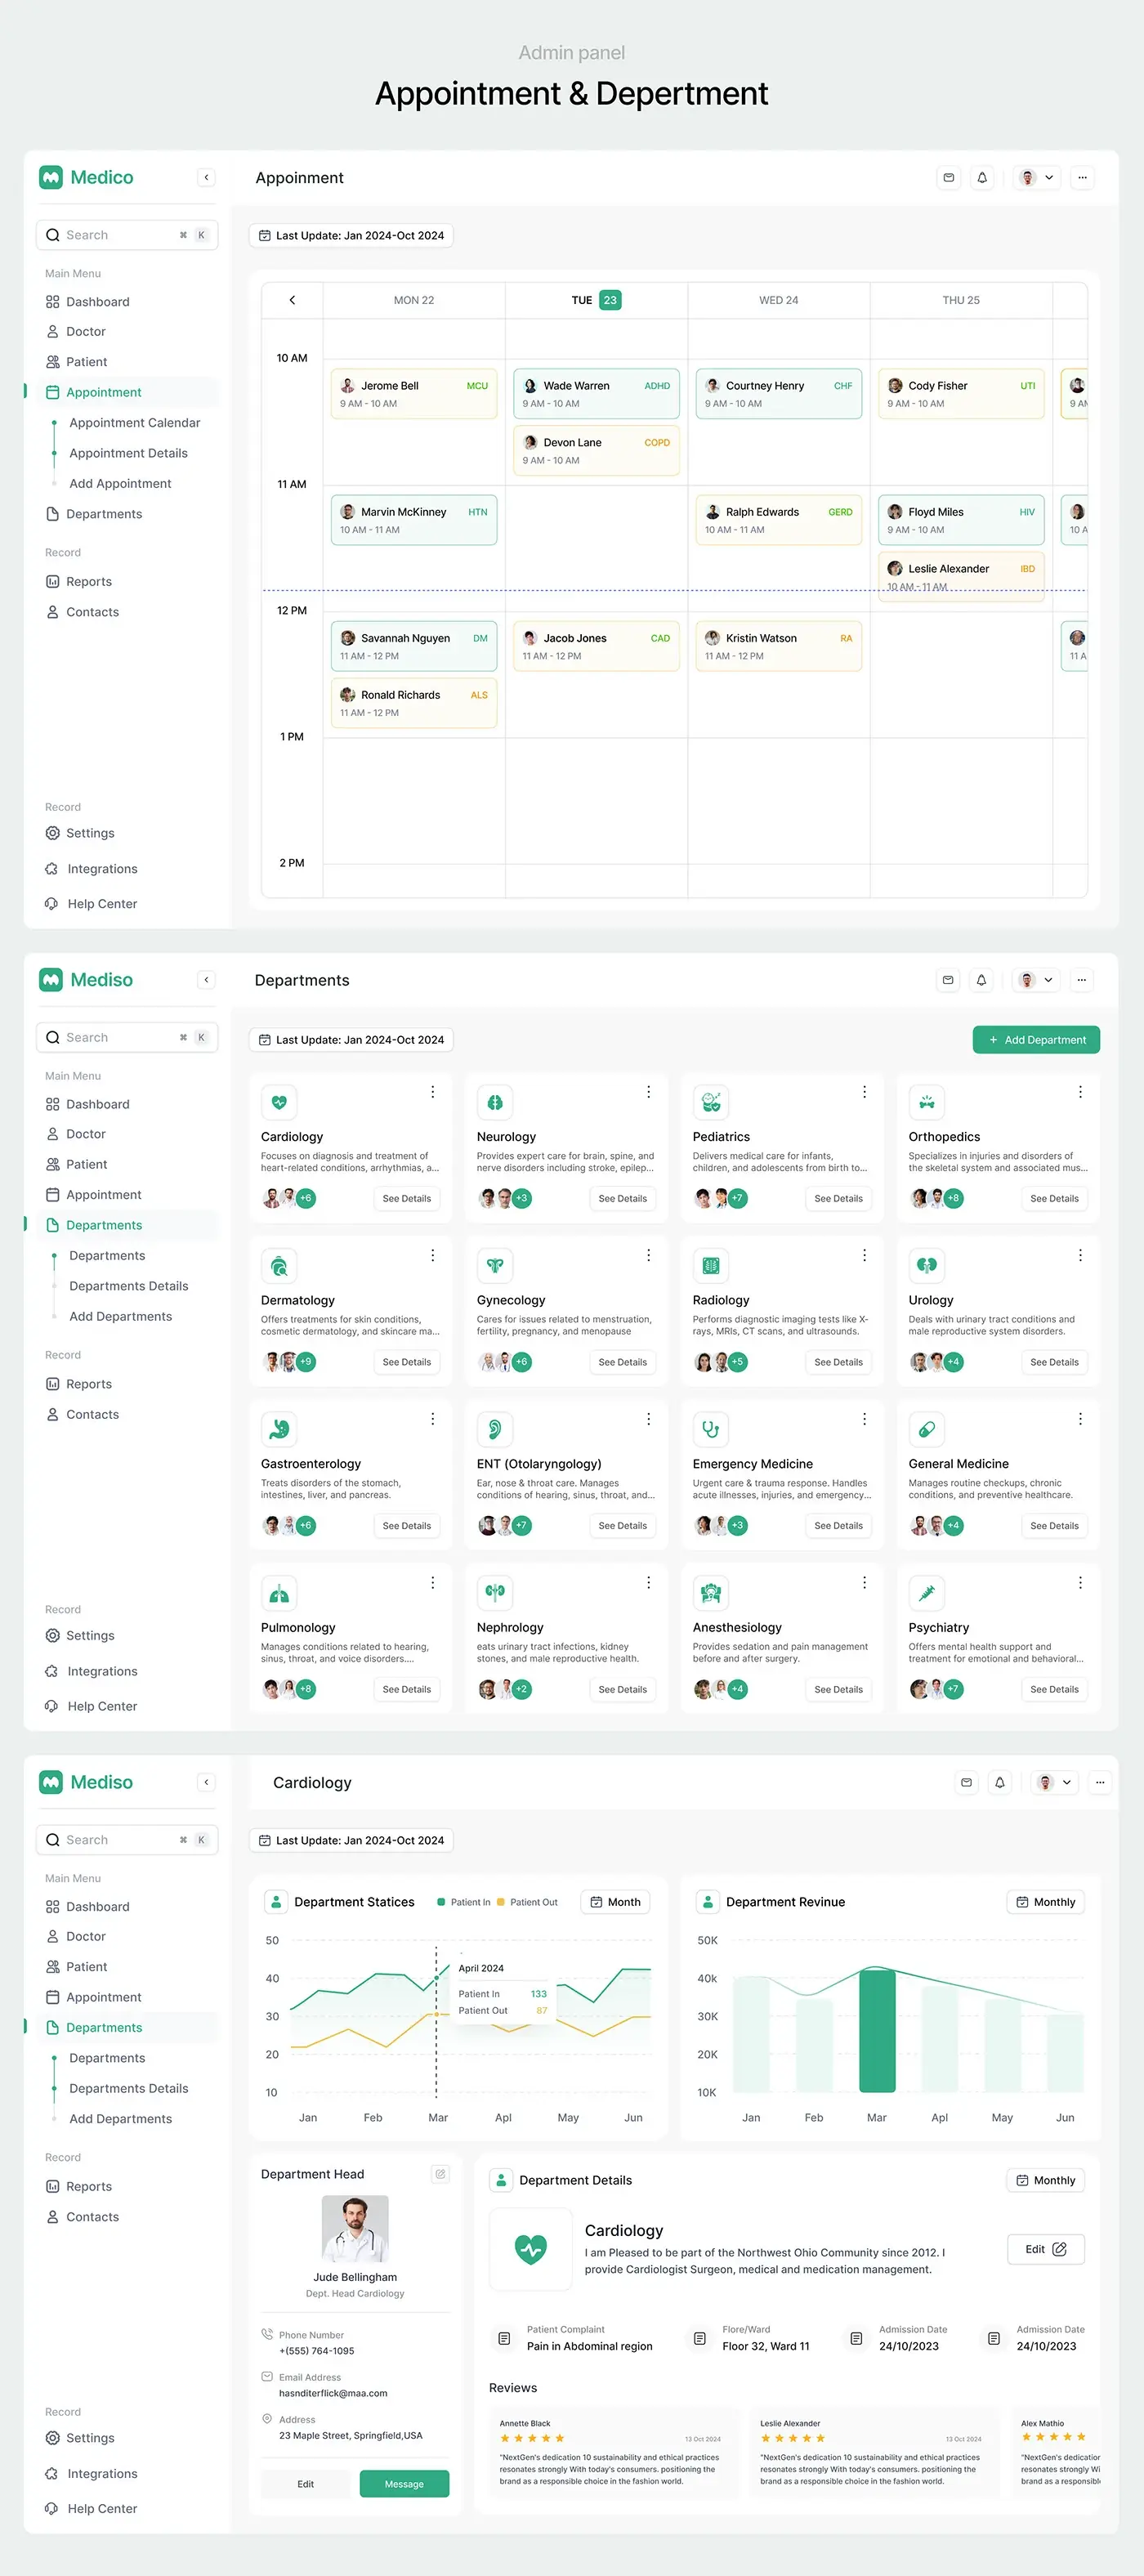
Appointments run on a week calendar with days across the top and hours down the side, and a dashed line marks the current time. Each booking is a small card with the patient's name, the time slot and a condition code such as HTN, COPD or CHF, tinted green or yellow. The sub-menu splits the calendar, appointment details and Add Appointment.
Departments
The departments page shows all 16 as cards with an icon, a one line description, staff avatars and See Details. Each department page charts patients in and out and monthly revenue, then shows the department head with contact details, an editable description and patient reviews. Every department gets the same card, so none gets lost in a long list.
The result
- The web dashboard: main screen, doctor and patient lists and profiles, appointment calendar and department pages.
- Add Doctor and Add Patient forms with document upload, plus CSV export and reports.
- A UI style guide for type and colour.
How it helps the client
The design lets a hospital admin check billing, arrivals and urgent reports on one screen, then go straight to any doctor, patient or department. Because every section shares one layout, staff learn it once and use it everywhere. More projects like this sit in my healthcare case studies. It's a good example of my product design for healthcare dashboards.