

A real estate dashboard is one screen where the people running a property business see stock, people and money together: how many properties are active, how the agents are doing, which customers need a call, and how revenue and rent are tracking against the goal. A good one answers the questions a manager asks every morning on the first screen, puts every number one click from the records behind it, shows each role only what it needs, and says where each figure comes from and how fresh it is. A custom one earns its cost when your workflow, data sources or roles don't fit off the shelf tools.
I'm a design engineer: I design products and build them in React and Next.js. Below is how I'd scope and design a real estate dashboard, walked through on Emura, a real estate management platform I designed. It's the kind of work on my product design service.
What a real estate dashboard must include
The metrics, grouped by question
- What's in stock? Active, pending and sold properties; vacancies and lease expiries if you manage rentals.
- How are sales going? Sales over time, days on market, leads by source, progress against the goal.
- How are the agents doing? Properties sold per agent, rating, open deals, response time.
- Who needs attention? Customers by need and stage, follow-ups due today.
- Where is the money? Total revenue, net profit, sales value against rental income, revenue against expenses, rent collected against rent due.
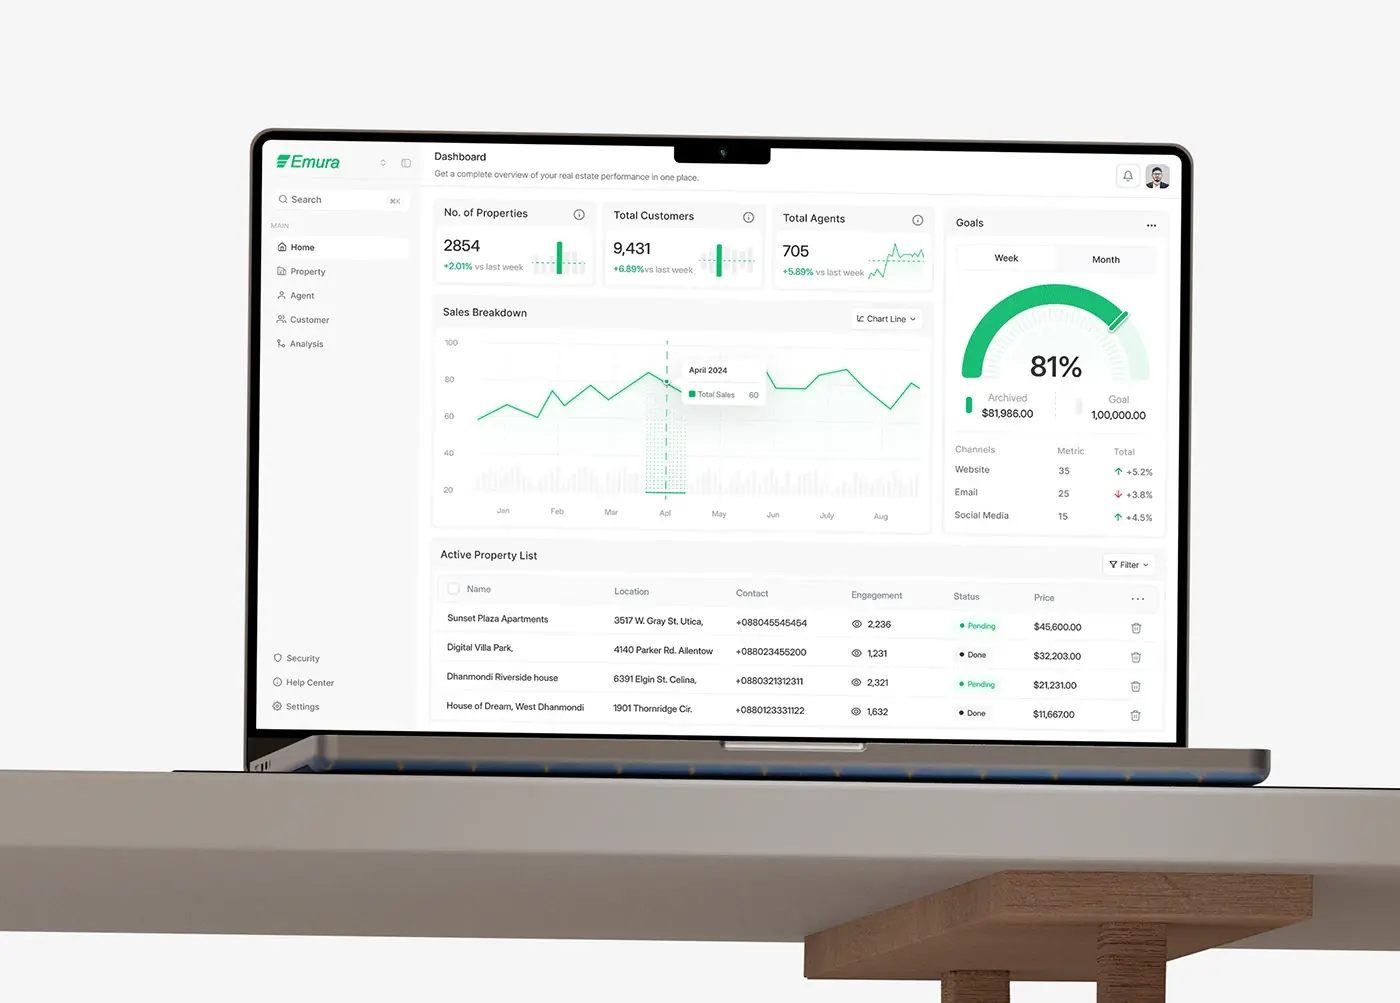
Each number needs a comparison, such as last week or last year, or it's just a figure. Emura's count cards each carry a change against last week and a small trend chart.
The views
Emura has five areas in one sidebar: Home, Property, Agent, Customer and Analysis. That split is a good default:
- Home: the counts, the sales chart, goal progress and the active property list.
- Properties: a list with a map, and a detail page that ties the listing to its agent.
- Agents: a directory to compare people, and a profile with their sales and deals.
- Customers: cards that lead with what each person wants.
- Analysis: revenue in depth, kept off the home screen so it stays readable.
Roles and permissions
Before drawing screens, I write down who logs in and what each person may see and change. An agent usually needs their own listings, leads and deals. A manager needs the whole team. Finance needs revenue and expenses, not customer notes. An owner or investor needs portfolio totals. A tenant portal, if you have one, is a separate product.
Broken access control sits at A01, the top of the OWASP Top 10 2025. In a dashboard, that means checking permissions on the server for every record, not just hiding buttons, and designing what an agent sees when they open a link to a deal that isn't theirs.
Data sources
The design depends on where the data lives, so I map sources in the first week.
- Listings. In the US, MLSs deliver data through the RESO Web API, a RESTful standard built on OData V4, and certify against RESO's Data Dictionary. Access is requested from each MLS, not from RESO.
- Your property management system for leases, rent and maintenance.
- A CRM for leads, customers and agent activity.
- Accounting for revenue, expenses and profit.
- Maps. Google Maps Platform's Dynamic Maps SKU gives 10,000 free billable events a month, then charges $7 per 1,000 in its first paid tier, per its pricing page last updated 30 October 2026. A busy internal tool can pass that.
- Spreadsheets. Usually the real source of truth at the start. Plan an import.
Show the source and the last sync time next to figures that come from elsewhere. Trust drops the first time a number disagrees with the accounting system and nobody can say why.
Charts people can read
Nielsen Norman Group's guidance on dashboards favours bar charts and line graphs, because people judge length and position well, and warns against pie charts, radial gauges and 3D effects. It also says colour should be a secondary cue. WCAG 2.2 asks for at least 3:1 contrast for the parts of a graphic needed to understand it. When I do use a gauge, as on Emura's goals card, achieved and target are shown with it, so the number never depends on reading an angle.
Common mistakes
- Every metric on the home screen. Emura's project deck named overloaded dashboards that bury the numbers that matter as one of its three problems.
- Data split across pages. Property, agent and customer data on separate pages that don't link feels like three tools.
- Revenue without hierarchy. Totals, then months, then line items. Not all at once.
- A map squeezed into a corner. Location is the first question about any property.
- Permissions as an afterthought. Adding roles after launch means redesigning screens and rewriting queries.
- No empty, loading or error states. A sync fails at some point; the screen should say so plainly.
- Desktop only. Managers check numbers on a phone between viewings.
How I'd approach your real estate dashboard
- A free 30 minute intro call. I ask who logs in, which questions they ask every day, where the data lives and what you use today.
- A written scope and one fixed quote for the whole project. No retainer, nothing billed by the hour.
- Discovery: industry research and a competitive analysis, plus the roles and data source map above.
- Information architecture before screens. On Emura: Home, Property, Agent, Customer and Analysis.
- Wireframes, then high fidelity design and a prototype, in weekly sprints in Figma, with a written update every 48 hours and a review call each week.
- A design system with tokens and components named the same in Figma and in code.
- The build. I build web apps and front ends in React and Next.js: permissions on the server, integrations behind one API, and the states for loading, empty and failed syncs. A person who knows the design reviews every change.
- Launch with real data, then fix what the first weeks of use show.
Case study: Emura, one dashboard for a real estate operation
Emura is a management platform where managers run the whole operation from one place: properties, agents, customers and revenue. I designed the web app, a mobile layout of its dashboard and the design system behind both, in 2025. The case study covers the design work.
The problem. The project deck named three: property, agent and customer data sat on separate pages and felt disconnected; overloaded dashboards buried the numbers that matter; and revenue and performance data had no clear hierarchy. Each got an answer: one dashboard with organised navigation, clean layouts with focused metrics, and charts that make revenue easy to read.
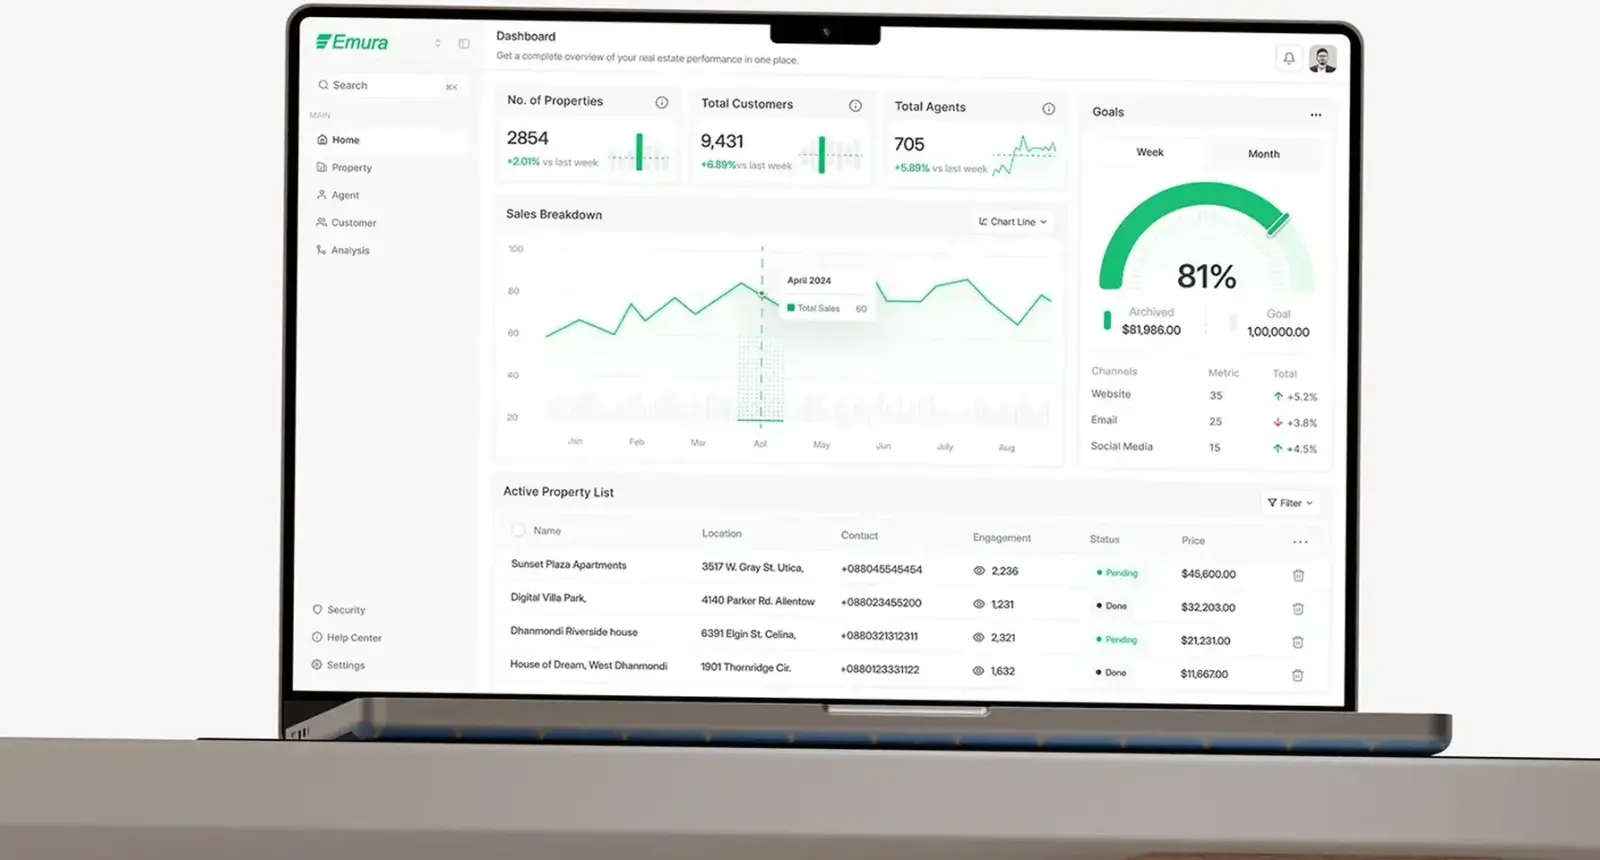
The home screen. Three count cards for properties, customers and agents, each with a change against last week and a mini trend chart. Below, a sales breakdown chart with a chart type switch beside a goals gauge with week and month tabs, achieved against target and results by channel: website, email and social media. An active property list closes the screen with location, contact, views, status and price.
Properties. Listing cards with photo, price, address, beds, baths and floor area, with share and save on the card. A map fills the right half with house pins; selecting one opens a small card with photo and price. The detail page holds the listing and its seller, with the assigned agent's reviews, rating, experience and contact in the right column.
Agents and customers. Agent cards carry ID, phone, email, properties sold, rating and years of experience, so a manager can compare at a glance. Customer cards lead with what each person wants, for example a first-time homebuyer exploring city centre apartments, then a phone number and a Message button.
Revenue analytics. Four cards: total revenue, net profit, property sales value and rental income, each against last year. Then a monthly bar chart splitting sales from rental income, track progress and a revenue growth meter, then revenue against expense. The money reads top to bottom, from totals to the months behind them.
Mobile. The same count cards stack in one column above the sales breakdown, so a manager away from a desk sees the same numbers in the same order.
The deck lists the web app at 40+ screens, plus the mobile layout, a design system in Inter with one green accent and a grey scale, and a prototype. More are in my real estate case studies and on the real estate industry page.
If your users are investors rather than managers, the dashboard changes. On AQARI, a fractional property investing web app for Saudi Arabia, the overview pairs portfolio value with rent received in one chart, above a properties table with net yield and next payout. I wrote that up in my fractional real estate app design guide.
What decides the cost of a real estate dashboard
I give one fixed quote after the intro call, so I won't put my own figures here. For market context, Clutch's UX pricing guide, updated 21 September 2026, puts the average UX project reviewed on its platform at $84,973.08 over 10 months, with $10,000 to $49,999 the most common range. Its web development guide, updated the same day, puts the average development project at $66,499.09 over 9 months, while saying most cost less than $10,000. Read the averages as a spread, not a price.
What moves the cost of a dashboard:
- Roles. Each role adds views, permission rules and tests.
- Integrations. An MLS feed, a property management system and accounting are three integrations, each with its own access process.
- Freshness. Nightly syncs are simpler than live updates.
- Maps. Usage beyond the free tier is a running cost, not a one-off.
- Mobile. A responsive dashboard, or a separate app.
- History and audit. Who changed a price or a deal stage, and when.
- Design only, or design and build.
How to choose who designs and builds it
Try an off the shelf tool first if your data already sits in one system that has reporting. Many property platforms and BI tools cover standard metrics, and that may be enough.
When you do need custom work, look for dashboards in the portfolio that show whole products, not one hero screen: lists, detail pages, empty states, mobile. Ask how they'd handle permissions, which data sources they've integrated, and how they'd show a sync that failed. Ask who designs and who builds, and how the two stay in step. My dashboard design examples post covers patterns worth asking about.
Frequently asked questions
What should a real estate dashboard show?
Property counts and status, sales against the goal, agent performance, customers needing follow-up, and revenue split into sales and rental income, each against a previous period. Detail pages, a map and analytics sit one click away.
What is the difference between a real estate dashboard and property management software?
Property management software runs the work: leases, rent, maintenance. A dashboard reads from it and from your CRM, MLS and accounting to show performance in one place. Some products do both; Emura brings properties, agents, customers and revenue into one web app.
Which data sources can a real estate dashboard connect to?
Typically an MLS feed through the RESO Web API, a property management system, a CRM, accounting software, a maps service and spreadsheets. Each has its own access process; MLS data is requested from the MLS itself.
Should I build a custom dashboard or use a template?
Use a template or BI tool if your data sits in one system and standard reports fit. Build custom when roles, workflows or several data sources don't fit, or when the dashboard is part of a product you sell.
Can you design a mobile version?
Yes. On Emura I designed a mobile layout of the dashboard that stacks the same count cards, with their weekly change, above the sales breakdown, so the order stays the same as on desktop.
Sources and method
I read every source on 1 November 2026. Clutch's figures come from reviews on its own platform and mix project sizes. Google's map prices change; check the live page before budgeting.
- OWASP Top 10:2025, date read 1 November 2026: top10.owasp.org
- RESO, RESO Web API, date read 1 November 2026: reso.org
- Google Maps Platform, pricing (last updated 30 October 2026), date read 1 November 2026: developers.google.com
- Nielsen Norman Group, Dashboards: making charts and graphs easier to understand (18 June 2017), date read 1 November 2026: nngroup.com
- W3C, Understanding success criterion 1.4.11 non-text contrast, WCAG 2.2, date read 1 November 2026: w3.org
- Clutch, UX design pricing guide (updated 21 September 2026), date read 1 November 2026: clutch.co
- Clutch, Web development pricing guide (updated 21 September 2026), date read 1 November 2026: clutch.co
Planning a real estate dashboard? Book a free 30 minute intro call. Bring the questions your managers ask every morning and a list of where your data lives, and a written scope and one fixed quote follow if you go ahead.
Tags: Real estate, Dashboards, Product design, Proptech, Data visualisation