

A good landing page conversion rate is one that beats your own last result, for the same traffic and the same goal. Published numbers give a rough frame: Unbounce's 2024 Conversion Benchmark Report puts the median landing page at 6.6% across more than 41,000 pages, with industry medians from 3.8% for SaaS to 12.3% for entertainment. LocaliQ's 2026 benchmarks put the average Google Ads conversion rate at 8.18%, counted as leads divided by clicks.
Those figures measure different things with different maths, so none of them is a target. I use them to spot a page that is far off, then work from its own baseline. That's how my landing page design services run: measure first, then test the changes most likely to matter, in a fixed order.
This is for founders, marketers and product leads with a live page and a number they aren't sure how to judge.
What published landing page benchmarks actually measure
Most "good conversion rate" articles quote a few studies. These are the ones I opened and checked on 13 October 2026.
| Study | Data period | Sample | What counts | Headline figure |
|---|---|---|---|---|
| Unbounce Conversion Benchmark Report 2024 | 23 July 2023 to 23 July 2024 | 41,000+ pages, 464 million visitors, 57 million conversions | Form and click events on Unbounce pages | 6.6% median |
| Unbounce Conversion Benchmark Report 2020 | 28 October 2018 to 28 October 2019 | 34,000 pages, 186 million visits | Form and click events; 62.6% of pages used forms | 3.2% median, 9.7% average |
| LocaliQ search advertising benchmarks, updated 1 June 2026 | Not stated | Its customers' Google Ads and Microsoft Ads campaigns | Leads divided by ad clicks | 8.18% average |
Unbounce works out each page's rate, then reports the page in the middle. LocaliQ counts per ad click, across whatever page the click reached, and averages.
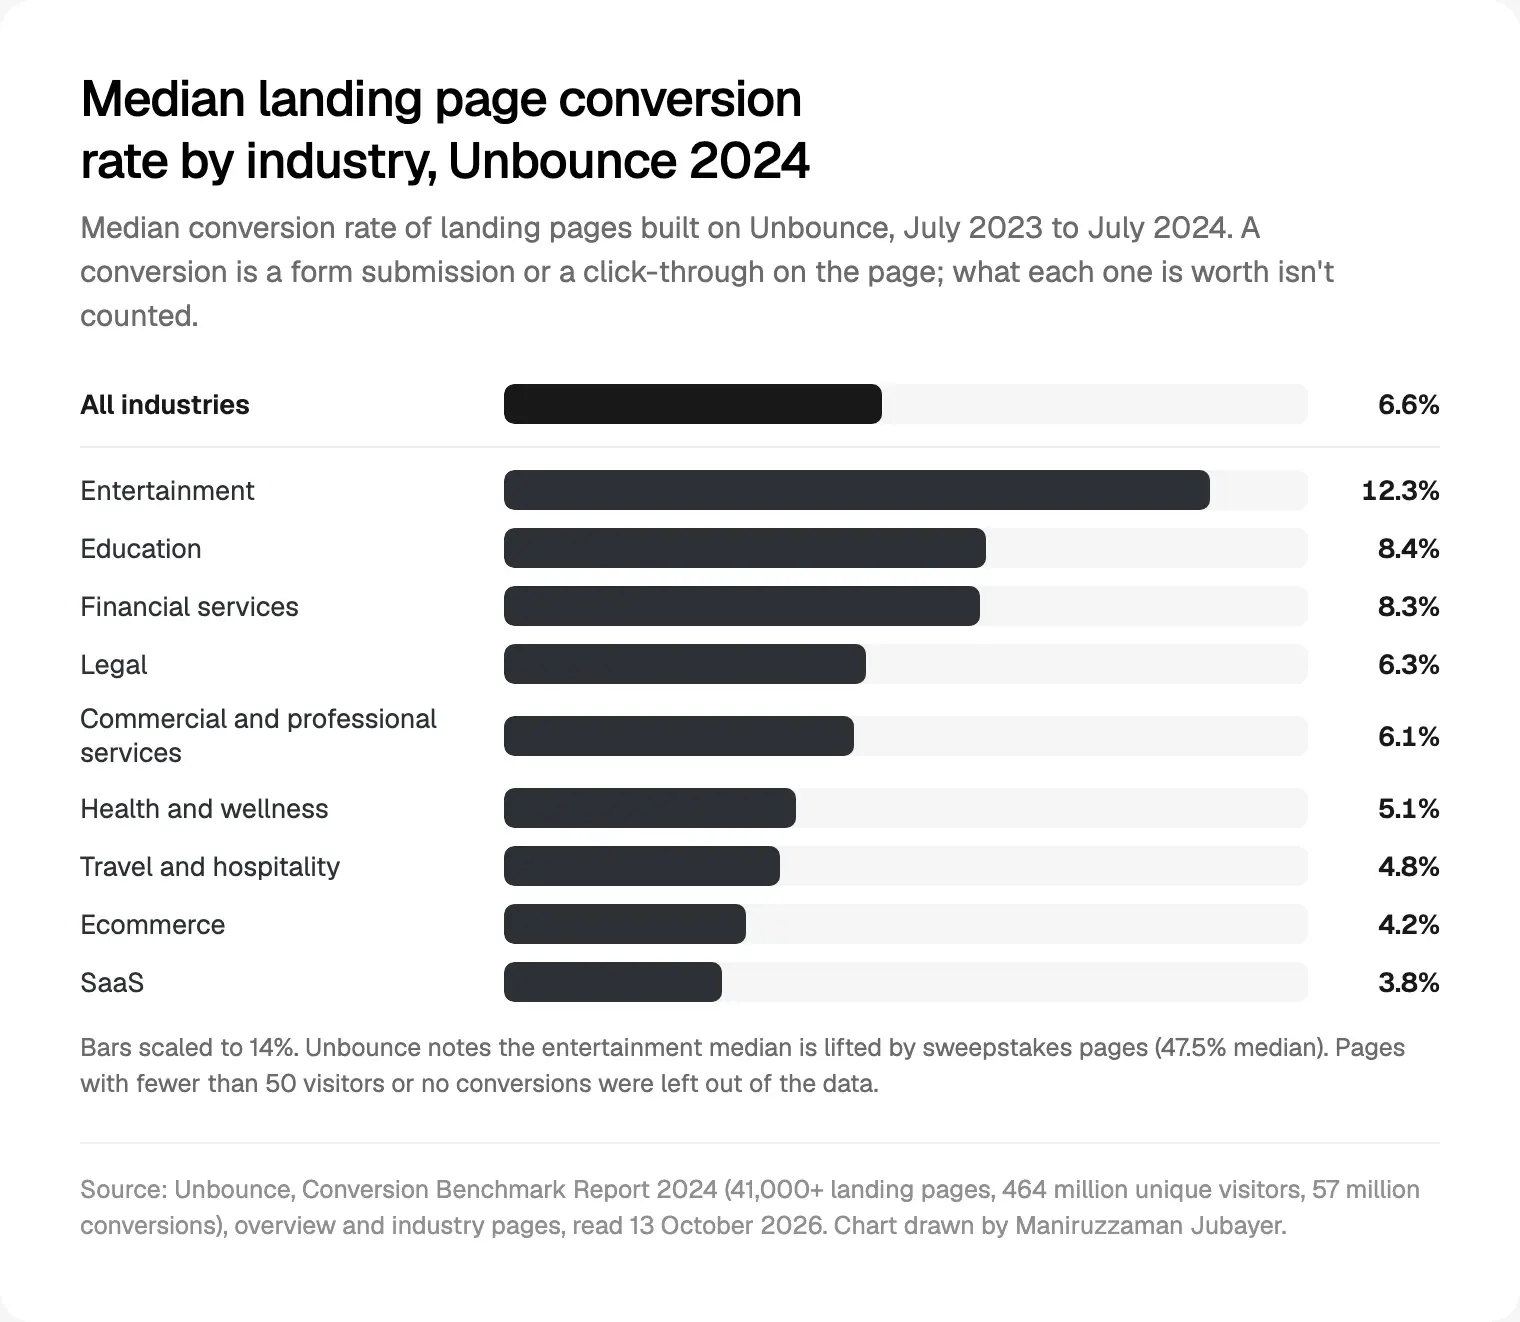
The spread inside one study beats the gap between studies. Unbounce's SaaS page puts SaaS 42% below the all-industry baseline. Its financial services page has insurance pages at 18.2% and investing pages at 3.9%, under one 8.3% median.
Across studies it gets stranger. LocaliQ's average for finance and insurance search ads is 2.64%, against Unbounce's 8.3%: same industry, three times apart, because one counts clicks to leads across a site and the other conversions on one page built for one offer.
Median, mean and the 3.2% that is also 9.7%
The same 34,000 pages in Unbounce's 2020 report gave a 3.2% median and a 9.7% average, and the top quarter had a median of 25%. A few pages converting very well pull the mean up, so the "average" describes almost nobody. Unbounce's 2020 methodology explains why it chose the median.
The 2024 report mixes the two, and its methodology page says so. Its channel figures are averages: email 19.3%, paid social 12%, paid search 10.9%. Put your one paid search page next to "10.9%" and you're comparing a single page with a mean lifted by the best pages.
Two filters move the numbers further. The 2024 data left out pages with fewer than 50 visitors or no conversions, and dropping every page that converted nobody raises the median. And every page belongs to a team paying for a builder with testing tools, which isn't a random slice of the web.
What these numbers count, and what they leave out
A benchmark conversion is an event, not money. Unbounce says its data ignored the value of each conversion, and gives its own example: LinkedIn traffic converted 4 to 5 times worse than Facebook and Instagram, yet those conversions may be worth more. A checklist download and a demo request also count the same.
Device and source move the rate as much as design:
- Mobile: 83% of visits in the 2024 sample were on mobile, and desktop converted 8% better overall. Financial services ran the other way, with desktop 22% lower.
- Source: email, paid social and paid search start at different averages before anyone touches the page.
- Copy: pages at a 5th to 7th grade reading level converted at 11.1%, against 5.3% for professional-level writing. That's a correlation across many pages, not a test of yours.
Why your own baseline matters more than any benchmark
I'd rather see a cold paid search page move from 2% to 3% than celebrate 12% from a warm email list. The first is a real gain on hard traffic; the second mostly describes who was already on the list.
My baseline is one page, one goal, one traffic source and one device class, over whole weeks so weekday patterns even out, with nothing changed on the page or the campaign meanwhile. I write it down before anyone opens the design file, so nobody argues about it after a test.
The comparisons I trust, in order:
- The page against itself, same source, before and after a proper test.
- The page against a sibling page for another ad group, same offer.
- The page against an industry median, only to ask whether something is badly broken.
I'd never redesign a page just because it sits below a median. Below 3.8% on cold LinkedIn traffic for a demo request may be a fine result.
How I measure a landing page conversion rate in GA4
A bad conversion rate is often bad measurement, so this is the setup I check before I believe any number.
- One goal per page. If the page has a demo form and a newsletter box, pick the conversion. The other is a secondary event.
- Mark it as a key event. Google describes key events in GA4 as the events you mark as important to your business. I fire it when the lead is accepted, not on the button click.
- Read session key event rate. GA4's metric definitions give it as sessions with a key event divided by all sessions. Pair it with the Landing page dimension, the path of a session's first page view.
- Check the counting method. Google's counting method page recommends once per event and labels once per session as legacy. It changes key event counts, not the session rate.
- Split by source and device. GA4's default channel groups separate Paid Search, Paid Social, Email and Organic Search. A blended rate hides most of what you need.
- Watch form starts. Enhanced measurement can record
form_start. Starts against key events show whether people quit the form or never reach it. - Know who is missing. In basic consent mode, nothing is sent for visitors who refuse, so your rate describes those who accepted.
Testing the tags themselves is in the tracking checks I run before launch. Expect your numbers to disagree:
| Number | How it's worked out | Where | What I use it for |
|---|---|---|---|
| Session key event rate | Sessions with a key event divided by sessions | GA4 | The page against itself |
| Google Ads conversion rate | Conversions divided by ad interactions | Google Ads | Bids and ad groups |
| Qualified lead rate | Leads sales accepts divided by sessions | CRM and GA4 | Whether the page brings the right people |
Google's conversion rate definition shows 50 conversions from 1,000 interactions as 5%. Different denominator, different attribution. Pick the number that judges a test before it starts.
How much traffic you need before a change is real
The testing mistake I guard against most is stopping early. Evan Miller's How Not To Run an A/B Test (18 April 2010) shows that checking after every visitor and stopping at the first "win" can make a change that does nothing look significant 26.1% of the time in his example, not 5%.
His fix is to set the sample size in advance, with a rule of thumb: n = 16 × p × (1 - p) / δ², where p is your baseline rate and δ the change to detect. Per version of the page:
| Baseline rate | Lift to detect | Change in points | Visitors per version |
|---|---|---|---|
| 2% | 20%, to 2.4% | 0.4 | 19,600 |
| 4% | 20%, to 4.8% | 0.8 | 9,600 |
| 4% | 10%, to 4.4% | 0.4 | 38,400 |
| 8% | 20%, to 9.6% | 1.6 | 4,600 |
I worked these out from his formula; his sample size calculator lets you set power and significance yourself.
Before a test goes live I fix the judging number, the sample size and an end date in whole weeks. With too little traffic, I test bigger changes, such as a new headline and offer.
The changes I'd test first, in order
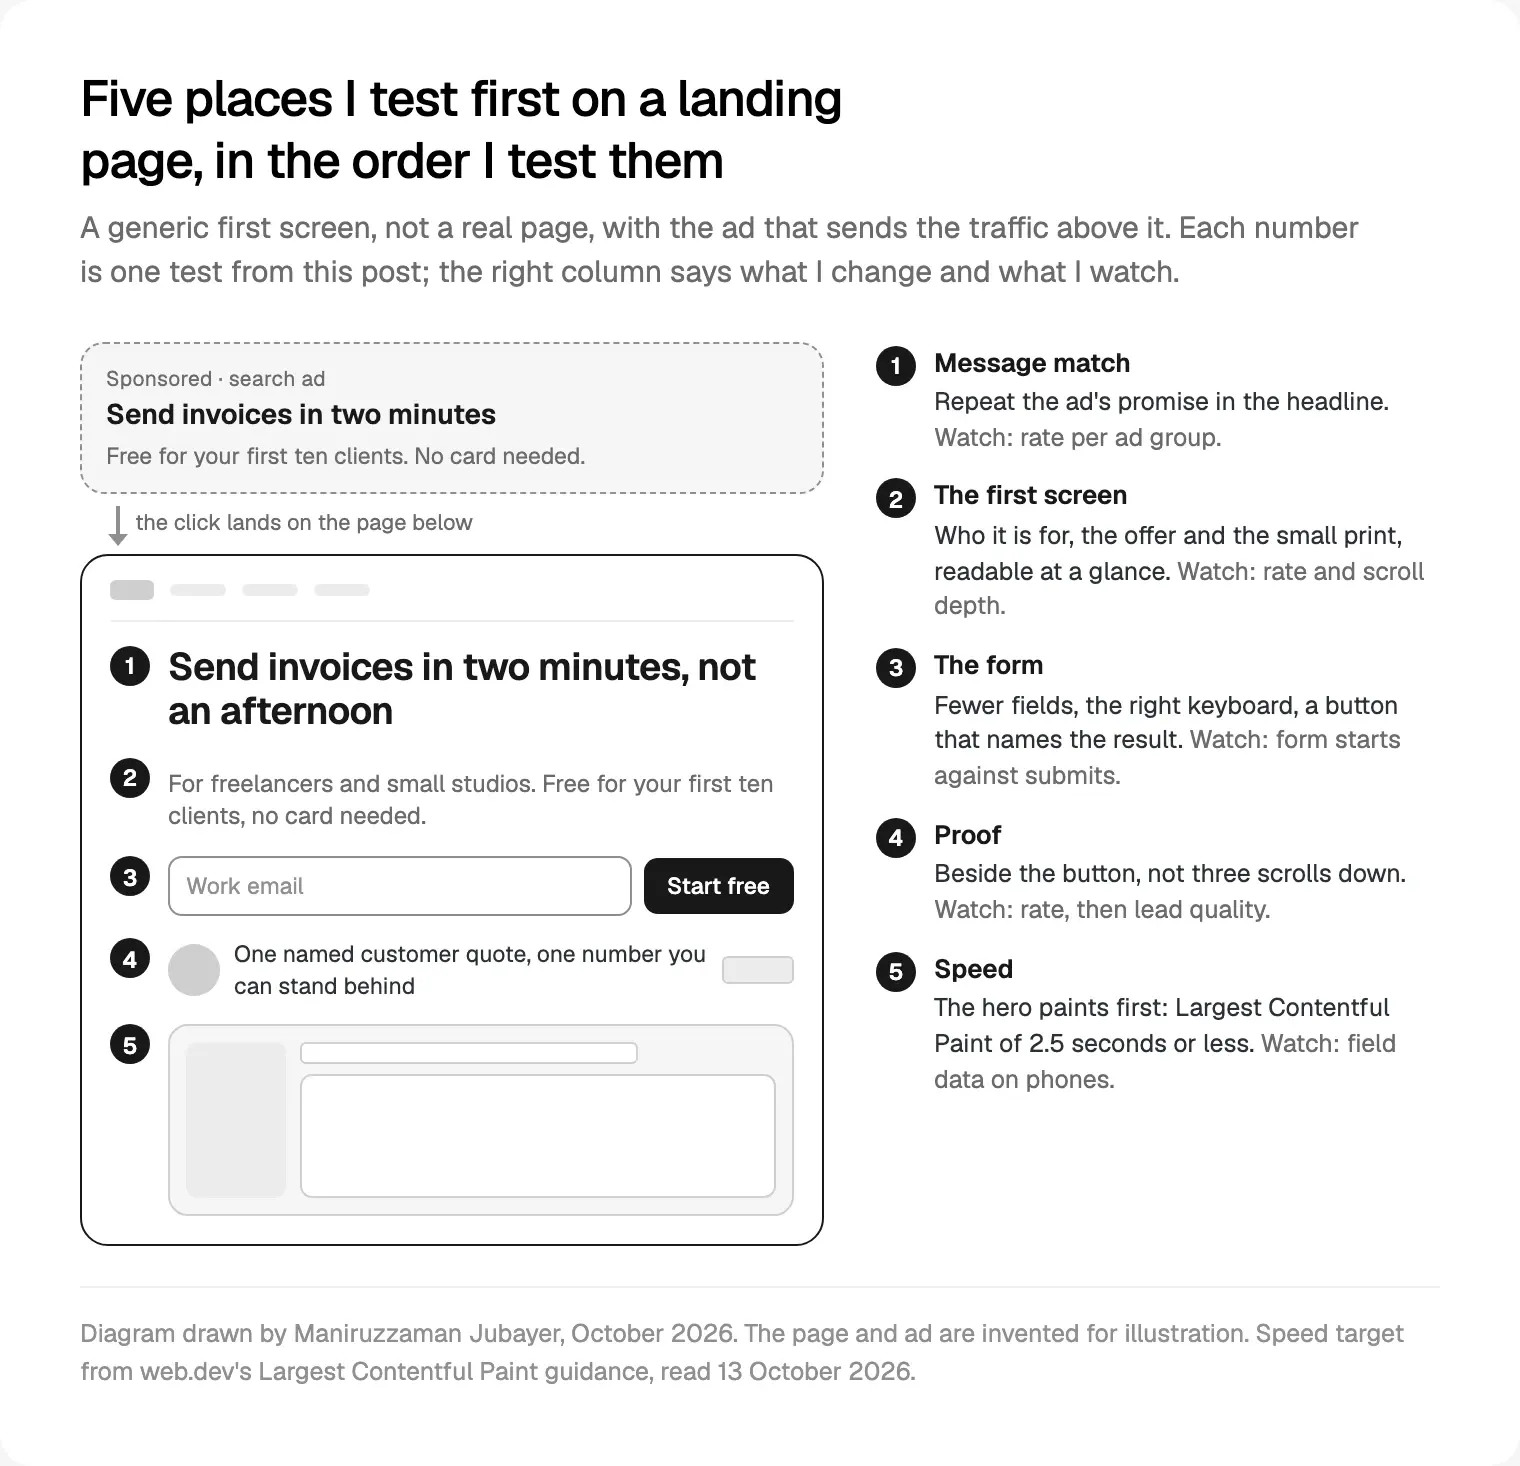
Fix what every visitor meets before what only some reach. A headline touches every click; a form only matters to people the headline persuaded.
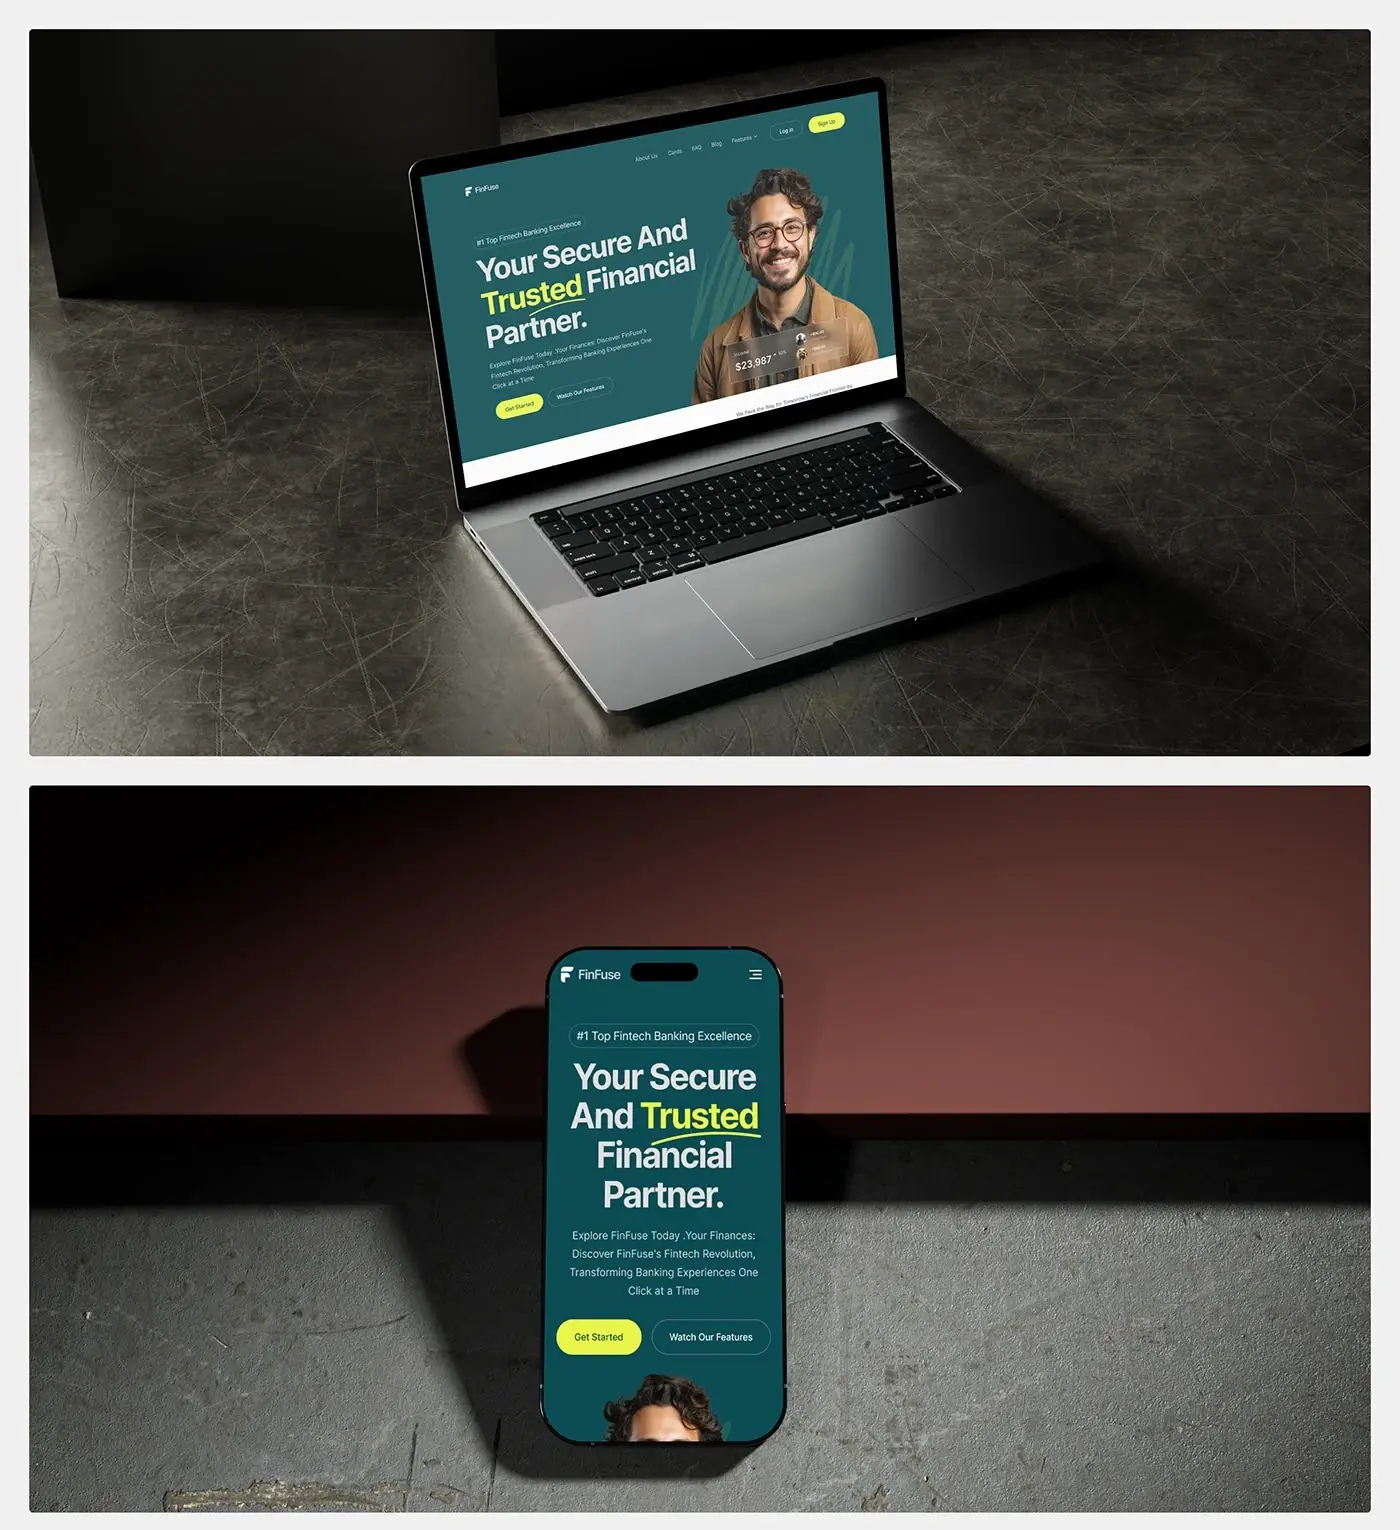
The tests run on landing pages I build in swappable blocks, so a headline or proof block changes without a redesign and keeps the same tracking.
1. Message match with the ad
Google's Quality Score documentation names landing page experience as one of three components: how relevant and useful the page is to people who click your ad. Unbounce's 2024 report also calls matching the page to the ad one of the best ways to lift paid search conversion.
I test a headline that repeats the ad's promise in the same words against the generic one. When ad groups promise different things, I test one page per promise. The judge is the rate per campaign, from the UTM campaign tag.
2. The first screen
It has to say who it's for, what they get and what happens after the click. I test the headline wording, a subhead that answers the first doubt, and true small print (free trial, no card) beside the button. Plain words help: Unbounce found more three-syllable words went with lower conversion, a correlation of minus 24.3%. For layouts, see eight landing page patterns from live pages.
3. The form
NN/g's form usability guidelines (1 May 2016) cite a CHI paper by Seckler and colleagues: forms that followed usability guidelines were submitted error-free on the first try 78% of the time, against 42% for forms that broke them.
I test removing every field the next step doesn't need, the right input types for phone keyboards, and a button that names the result ("Book my demo"). I watch form starts against key events, by device.
4. Proof beside the button
People look at what others did before deciding, as NN/g's article on social proof in the user experience (19 October 2014) describes. I found no dated study of proof placement on landing pages I'd trust with a number, so I test it.
I test one named customer quote against a logo strip, and one specific number you can stand behind against none, beside the button. I watch the rate, then lead quality, because strong proof can bring more of the wrong leads.

5. Speed
Google calls a Largest Contentful Paint of 2.5 seconds or less good, and an Interaction to Next Paint of 200 milliseconds or less, both at the 75th percentile of page loads, mobile and desktop judged separately.
The best dated study I could open is Milliseconds Make Millions, commissioned by Google and run by 55 and Deloitte across 37 brand sites and 30 million sessions at the end of 2019. On lead generation sites, a 0.1 second gain across four speed metrics went with 21.6% more users reaching the form submission page. It was observational and Google-funded, and one metric is now deprecated, so I read it as direction.
Speed comes fifth because a fast page with the wrong promise still wastes the click. If the hero misses 2.5 seconds on phones, though, I fix it first: that's a bug, not a test.
What I don't test early
- Button colours. They rarely move a low-traffic page enough to measure, and they use up weeks.
- Five changes at once, unless traffic allows nothing else and you accept not knowing which one worked.
- A benchmark as the goal. "Reach 6.6%" isn't a hypothesis; "repeating the ad's promise lifts paid search conversion here" is.
Where I would start
Find one number in GA4: your page's session key event rate, for one source, on phones, over the last four whole weeks. If you can't get it cleanly, fix measurement before design. If you can, compare it with last month, not with a benchmark. Then run the first test on message match, since it touches every visitor and is usually the easiest change to judge on modest traffic.
If you'd rather hand the loop over, it's part of my landing page work for launches and paid campaigns. It starts with a free 30 minute intro call, then a written scope and one fixed quote, with no retainer. I check tracking on the live page and plan the first A/B test from launch week's numbers, with a Slack update every 48 hours and a review call each week.
Frequently asked questions
What is a good landing page conversion rate?
One that beats your own baseline for the same page, goal and traffic source. As a rough frame, Unbounce's 2024 Conversion Benchmark Report puts the median landing page at 6.6% across all industries, with industry medians from 3.8% for SaaS to 12.3% for entertainment. Use them to spot a page that is badly off, not as a target.
What is the average landing page conversion rate by industry?
In Unbounce's 2024 report, medians were 12.3% for entertainment, 8.4% education, 8.3% financial services, 6.3% legal, 6.1% professional services, 5.1% health and wellness, 4.8% travel, 4.2% ecommerce and 3.8% SaaS. They cover pages built with Unbounce, counting form and click conversions, from July 2023 to July 2024.
Is a 2% conversion rate good for a landing page?
It can be. On cold paid search traffic for a demo request, 2% may be a solid result, while 2% from a warm email list usually means something is broken. Check the traffic source, device mix and size of the ask, then compare with the same page last month.
How do I calculate landing page conversion rate in GA4?
Mark the page's one goal as a key event, then build an exploration with the Landing page dimension and the Session key event rate metric: sessions with a key event divided by all sessions. Split it by session default channel group and device, and fire the key event when the lead is accepted, not on the click.
Why is my Google Ads conversion rate different from GA4?
They divide by different things. Google Ads divides conversions by ad interactions; GA4's session key event rate divides converting sessions by all sessions from every source. Attribution, counting method and consent differ too. Neither is wrong: decide before a test which number judges it.
How much traffic do I need to A/B test a landing page?
It depends on your baseline and the lift you want to detect. With Evan Miller's rule of thumb, a 4% baseline needs about 9,600 visitors per version to detect a 20% lift, and a 2% baseline about 19,600. Fix the number in advance, run whole weeks, and don't stop at the first good result.
Does page speed affect landing page conversion rate?
The evidence points that way. In the Google-commissioned Milliseconds Make Millions study, lead generation sites saw 21.6% more users reach the form submission page after a 0.1 second gain across four speed metrics. It was observational, so treat it as direction, and aim for a Largest Contentful Paint of 2.5 seconds or less on phones.
Sources and method
I read every source on 13 October 2026. Unbounce's charts are images, so I took each industry median from the text of its industry pages. LocaliQ's page doesn't state its data period or sample, and WordStream's copy of the benchmarks blocked my requests. The sample sizes are my own arithmetic from Evan Miller's formula. I quote no results for my own work.
- Unbounce, Conversion Benchmark Report 2024, overview and methodology, read 13 October 2026: unbounce.com, unbounce.com
- Unbounce, Conversion Benchmark Report 2024, industry pages (SaaS, financial services, ecommerce, professional services, health, travel, education, legal, entertainment), read 13 October 2026: unbounce.com, unbounce.com, unbounce.com, unbounce.com, unbounce.com, unbounce.com, unbounce.com, unbounce.com, unbounce.com
- Unbounce, Conversion Benchmark Report 2020 and methodology, read 13 October 2026: unbounce.com, unbounce.com
- LocaliQ, 2026 Search Advertising Benchmarks, updated 1 June 2026, read 13 October 2026: localiq.com
- Google Analytics Help, key events, metric definitions, counting method, channel groups and enhanced measurement, read 13 October 2026: support.google.com, support.google.com, support.google.com, support.google.com, support.google.com
- Google Tag Platform, consent mode overview, read 13 October 2026: developers.google.com
- Google Ads Help, conversion rate definition and Quality Score, read 13 October 2026: support.google.com, support.google.com
- Evan Miller, How Not To Run an A/B Test, 18 April 2010, and Sample Size Calculator, read 13 October 2026: evanmiller.org, evanmiller.org
- Nielsen Norman Group, Website Forms Usability, Kathryn Whitenton, 1 May 2016, and Social Proof in the User Experience, Jen Cardello, 19 October 2014, read 13 October 2026: nngroup.com, nngroup.com
- web.dev (Google), Largest Contentful Paint, Interaction to Next Paint, and Milliseconds make millions, read 13 October 2026: web.dev, web.dev, web.dev
Tags: Landing pages, Conversion, Analytics, A/B testing, Core Web Vitals